Some Charts You May Or May Not Find Useful
A little housekeeping to wrap up the 2023 season
Hey, everyone!
I hope you had a lovely holiday season and are off to a good start in the new year. I went home for a short break and have been getting in some much-needed leisure time and hiking in to start 2024.
I’m just getting a post out to handle a few final pieces of housekeeping to wrap up the content for the 2023 season.
I keep various charts during the year to help me analyze NU’s play and thought they might be of some use/interest to other Husker fans and decided to share. And because you guys are the ones who actually pay me for this, I figured you all should have access over just making them public.
First is a big spreadsheet tallying up all of the data from each game into an aggregate total. This is the spreadsheet to look at if you want to know, for instance, how many times NU ran Cover 3 against Michigan State, its success rate on Counter plays against Maryland, or the total amount of snaps Nebraska played in 12 personnel for the season.
There are four columns for each game: Usage Totals, Usage Percentage, Success Totals, and Success Percentage.
The Usage Total column will list how many snaps in that game Nebraska did that certain variable. So for the screenshot above, that would mean Nebraska ran 11 personnel for 27 snaps and 12 personnel for 17 snaps against Minnesota. The Usage Percentage column will tell you what percentage that variable’s usage was of Nebraska’s total snaps for that game: So Nebraska used 11 personnel on 49.09% of its snaps (27 snaps is 49.09% of 55 total snaps) and 12 personnel on 30.91% of its snaps (17 is 30.91% of 55 total snaps) against Minnesota.
The Success Total column tells you how many “successful” plays Nebraska had while operating out of that certain variable. So, again in the screenshot above, that would mean Nebraska had 14 successful plays out of 11 personnel and seven successful plays out of 12 personnel against Minnesota. The final column, Success Percentage, is the number of successful plays of that variable divided by the total snaps of that variable for each game, to calculate that variable’s success rate. So, Nebraska had a 51.85% success rate out of 11 personnel (14 successful snaps of 11 personnel divided by 27 total snaps of 11 personnel) and a 41.18% success rate out of 12 personnel (seven successful snaps out of 12 personnel divided by 17 total snaps out of 12 personnel) against Minnesota.
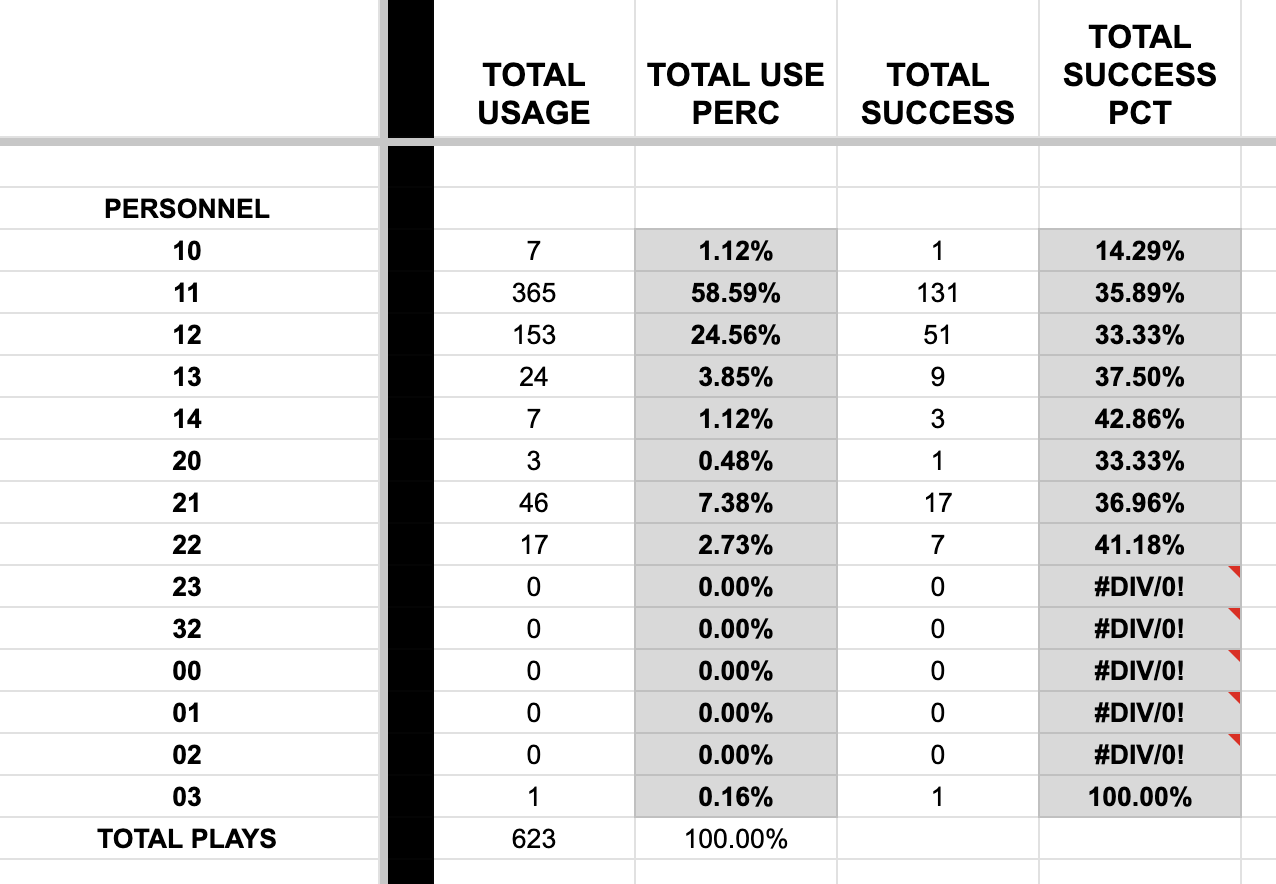
Then, there are final columns at the end adding up all of the instances of each variable in every game to give us a season-long total:
The four columns here (Total Usage, Total Usage Percentage, Total Success, and Total Success Percentage) all follow the same logic as the game columns above, just for the season-long data. I use this spreadsheet to track things during the season, so it’s not the most artful or visually appealing chart ever, but it might have some data you want to access throughout the offseason.
The second charts are big compilations of every offensive and defensive snap Nebraska ran this season. This is the spreadsheet to use if you want to sort to see every snap of Empty formations that NU ran this year or see all the plays they ran on third-and-long. The headers at the top of each are pretty self-explanatory. The final column lists which game the snap occurred. You should be able to sort each column here by right-clicking at the very top column and selecting “Sort sheet A to Z”:
But let me know in the comments below if this isn’t working in the viewable sheet and I’ll see if I can come up with a workaround.
Then, finally, I’ve put all of the offensive and defensive game breakdown sheets here so that they’re centralized in one spot and easy to access.
Keep reading with a 7-day free trial
Subscribe to Black 41 Flash Reverse to keep reading this post and get 7 days of free access to the full post archives.


