TENDENCIES: 2023 Full-Season Offense
A gruesome postmortem on the worst offensive season in Nebraska's modern history

Glossary of Terms1
After each game, I chart every snap to log various elements and variables of how Nebraska played schematically and how successful each was. I then add up the results in a big spreadsheet that shows me each game from the whole season and a cumulative total, giving me percentages and letting me see trends on how the Huskers are operating and what is working.
College football teams have been doing something like this — though it’s light-years more advanced, digitized, and accessible now than it was even 20 years ago — for decades. Coaches have been looking at and tabulating things like, “How often does a team run to the boundary on first down?” or “What coverages are we going to get on third down?” since the modern era of football began. People talk about football analytics like it’s something new, when teams have been compiling and evaluating data and providing it to help their players for 50 years. They just didn’t call it analytics back then.
This is a pretty rudimentary attempt at compiling the same thing teams do. Below are charts showing various percentages of tendencies on how Nebraska operated in 2023 and how successful those tendencies were by success rate. I’ve broken it up further into the first half of the season (the games against Minnesota, Colorado, Northern Illinois, Louisiana Tech, Michigan, and Illinois) and the second half of the season (the games against Northwestern, Purdue, Michigan State, Maryland, Wisconsin, and Iowa) so that we can compare and contrast how NU’s modes of operation changed as the season progressed and how successful they were. That’s in the first two sets of columns. I’ve also provided a third set of columns with the cumulative, full-season totals. On the left of each set of columns, you’ll see the percentage for how often a particular data point was used by Nebraska, and on the right of each set of columns, you’ll see the success rate for plays with that data point in gray.
That’s a lot of information, but it’s simplified if you think about it this way: The darker red column is how much Nebraska used something in the first six games of the season, the lighter red column is how much Nebraska used something in the final six games of the season, and the black column is its combined total for the entire season — and the gray columns next to each are how often that element worked in that part of the season.
I’ve broken the categories up into General Performance, Alignment/Special Formations, Personnel, Pre-Snap Operation, Play Distribution, Run-Game Tendencies, Run-Game Concepts, Pass-Game Tendencies, Pass-Game Performance, and Pass-Game Concepts. Some of the numbers in the graphics come off kind of small in the thumbnail view, but you should be able to click on the graphic and it will enlarge.
General Performance
Nebraska’s offense was near the bottom of the national rankings for most important statistical indicators in the first half of the year, then got somehow significantly worse in almost all of them in the back stretch of the season.
Compared to the first six games of the season, in the second half of the year, NU’s success rate fell by seven percentage points, it turned the little yardage it did get into fewer points, fell off in efficiency on early downs, generated fewer explosive plays, and allowed opposing defenses to cause more chaos. Seems bad!
Some of the drop-off can be framed by the rash of injuries the offense sustained — NU played with backups at eight of 11 offensive starting positions at one point in the second half of the season — and the Huskers’ early slate did feature games against Colorado, Northern Illinois, and Louisiana Tech, three bad defenses that boosted a lot of Nebraska’s first-half numbers. But even by schedule- and opponent-adjusted metrics, the Huskers fell significantly. NU’s SP+ ranking — which compensates for the quality of your opponent — dropped from a below-average national ranking of 87th after the first six games to 121st by season’s end. Even compensating for the opponents it was playing, things really got a lot worse for the offense as the season went on.
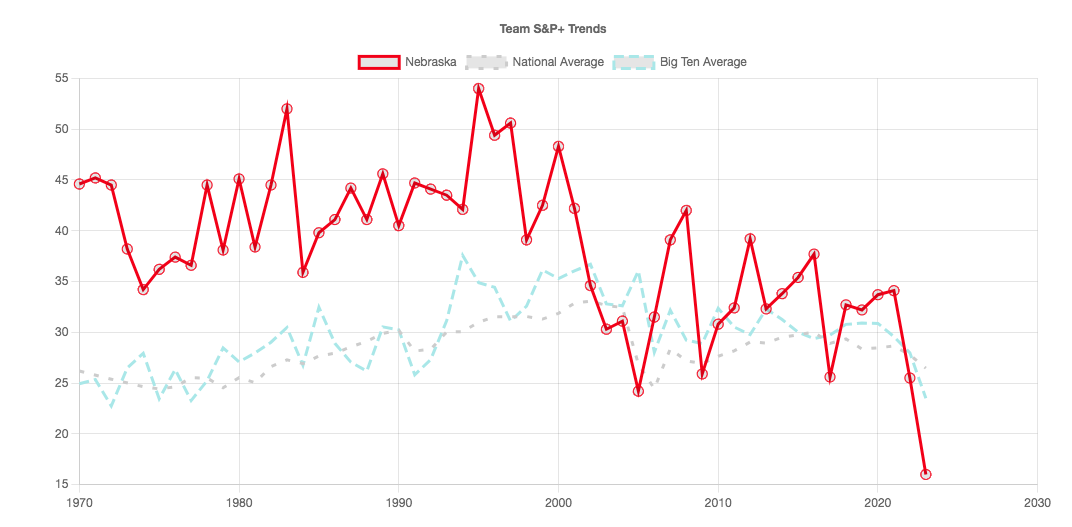
In whole, this was, unequivocally, the worst offensive season in Nebraska’s modern football history. Below is a graph (courtesy of CollegeFootballData.com) charting Nebraska’s SP+ offensive rating since 1970. This stat is a holistic measure of both how efficient and explosive your offense is, and adjusts for both quality of opponent and the era and offensive environment the season was played in. It’s a good general measure for the overall quality of your offense. Want to see what it looks like to drive off a cliff?
Even the most infamous offenses in recent Husker memory like 2005, 2009, and 2017 cleared a 24.0 offensive rating. NU this year was 15.7.
If you’re looking for an optimistic spin, Nebraska this year was one of the best teams in the country at converting in short yardage, with a nearly 70% success rate in those situations. And it did improve in one area in the second half, dropping the average length it needed to convert on third down by nearly a full yard. Anecdotally, it seemed like Nebraska embraced a more conservative style of ball in the back half of the season, so this makes a little sense. At least a couple positive takeaways!
It was also funny NU had an identical rate of third- and fourth-down conversions in the first and second halves of the season.
Alignment/Special Formations
The two biggest trends to notice here are the drop-off in the use and efficacy of the I-formation package and the increase in condensed formations in the back half of the year.
Coach Matt Rhule and offensive coordinator Marcus Satterfield both talked a big game in the preseason about running out of the I with a fullback, and they did at a pretty high rate and with pretty decent success in the first half of the year.2 But in the second half of the season, they used it almost half as much as the success dried up. The usage of the I went from 12% of all offensive snaps in the first six games to 7% in the back half of the season, largely, I’d imagine, because defenses were stopping it more effectively: Nebraska’s I package was among its best by success rate in the first half of the season, then dropped to a 25% success rate as Big Ten defenses teed off on it with heavy boxes NU could never force them out of. If they want to run the I look next year, they’re going to have to find more answers out of it then what they had in 2023.
Nebraska also started playing with nearly double the amount of condensed splits later in the year (13.6% usage in the first six games to 27.1% in the final six). There was a pretty dramatic shift in the back half of the year by NU to cut down receiver splits, both to get more corners involved in the run game and to throw deep crossing routes off play-action, which are more effective and create more space with the receivers aligned tighter. If you remember, NU was getting some of its best run plays in the back half of the season out of its under center and pistol bunch formation packages with pullers and motion, with everyone condensed down tight. It’s about the only card Satterfield had to pull down the stretch.
Personnel
The personnel usage largely remained consistent over the whole season, with Nebraska spending just over half its time in 11 personnel (one back and one tight end), with about another quarter of its snaps in 12 personnel (one back and two tight ends), and an assortment of other personnel packages mixed in a little bit to comprise the remaining snaps. Overall, NU in 2023 did run a more diverse personnel array than in previous seasons: In the first half of the year, Satterfield utilized five different personnel groupings at over 5% of Nebraska’s snaps, whereas former offensive leaders Scott Frost and Mark Whipple utilized just two and three groupings over 5%, respectively, in 2021 and 2022.
Keep reading with a 7-day free trial
Subscribe to Black 41 Flash Reverse to keep reading this post and get 7 days of free access to the full post archives.


