


TENDENCIES: 2024 Full-Season Defense
Evaluating the personnel, fronts, boxes, blitzes, coverages, and rotations that Nebraska’s defense ran in 2024 and what they say about the future

One exercise I’ve done every year of this newsletter is to collate all the data I chart at midseason and at the end of the year and present it in total, outside of the individual games.
I find this a useful exercise because it can provide real data on how, exactly, Nebraska is operating on the field. That data can then provide tangible insight into what the strengths and weaknesses of a team were. Did a previously light-blitzing defensive coordinator send a lot of pressures one year? They probably didn’t think they had a very good four-player pass rush. Did an offense call more quick-passing concepts than usual? The OC was probably more worried about protection than in past seasons, or they didn’t trust the quarterback to throw down the field. You get the picture. Get any data set big enough, and things will revert to the middle, but when we do see big changes in the numbers — especially over a full season of data — we can confirm trends we saw on film or question popular narratives that developed about the team.
This is the defensive version of that post for the 2024 season. The Nebraska defense in Matt Rhule’s first season made an astounding jump, finishing top 10 nationally in the SP+ defensive efficiency metric, 11th in FEI, and 20th in FPI after many of the same players formed an abysmal unit in 2022 that was one of the worst in the major conferences. In 2024, returning nine starters from that stellar 2023 group, many expected a strong unit but also slight step back from the Blackshirts, if only because it would be hard to replicate what they did a season before.
But for the first half of 2024, NU was better on defense than it had been the previous season, taking over the No. 1 spot in SP+ nationally after six games and putting together a dismantling performance of a Colorado offense that would go on to torch the Big 12 in conference play. The second half of the year proved tougher: Nebraska faced three offenses that finished in the top 15 nationally in efficiency in Indiana, Ohio State, and USC — including an embarrassment in a marquee matchup in Bloomington — and had an uncharacteristic stinker performance in a game against a mediocre UCLA attack. Even after closing the season strong with a shutdown of Iowa’s elite rushing attack and an impressive performance in the Pinstripe Bowl, the seeming leakiness of that four-game stretch took some shine off the unit and dropped the efficiency numbers into the territory everyone expected before the first kickoff: A “slight step back.”
The data from this season presented in this post can help us evaluate what went into that “slight step back.” During the year, I chart elements of Nebraska’s personnel; play-type defense; fronts; shifts; boxes; safety shells and positioning; rushers; blitzes; stunts; coverages; press usage; and back-end rotation to inform my writing. I also chart how effective each of those elements is through a popular metric called “success rate.”1 All of that data has been tallied and presented here as percentages of usage on Nebraska’s total defensive plays run and their success rate on plays using that element. I realize just reading percentages is boring, so I’ve also tried to highlight notable changes and what they might say about Nebraska’s performance, coaching, or personnel decisions.
Here’s a quick guide on how to understand/read the charts listed here:
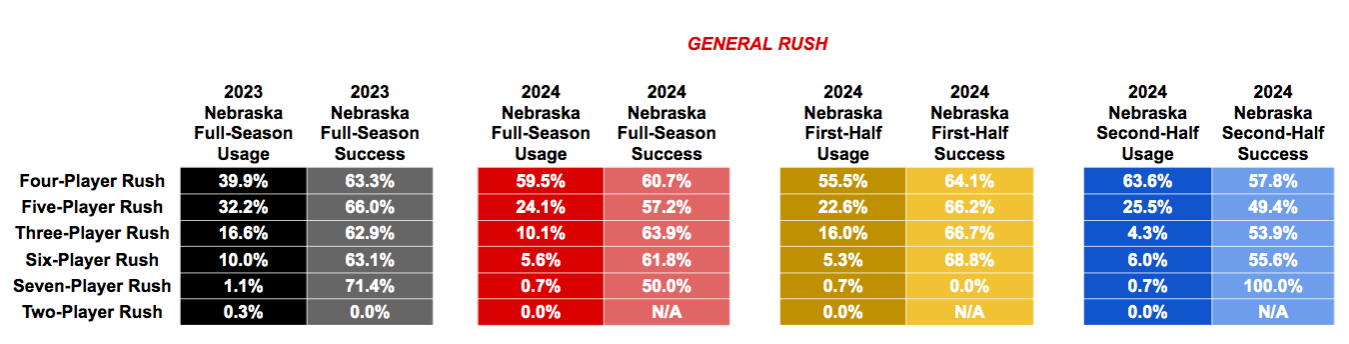
This is just one example from later in the post. The first two columns on the left in black and grey are the data from last season, with the black the usage rate (how often Nebraska used said element as a portion of its total plays) and the grey the success rate (how often said element is working). The two columns on the right in red and lighter red are the full-season data from this year, with the dark red the usage rate and the lighter red the success rate. The gold column and yellow columns are the isolated data from the first six games of the season (UTEP, Colorado, Northern Iowa, Illinois, Purdue, and Rutgers), and the blue columns are the isolated data from the final six games of the season (Indiana, Ohio State, UCLA, USC, Wisconsin, and Iowa).2 This data does not include the bowl game, as I didn’t want to taint the data set with information from a game I essentially view to be an exhibition contest with opt-outs.
So, to be specific for the graphic above:
the black column tells you how often NU used each type of rush in 2023 total;
the gray column tells you how effective each type of rush was in 2023 total;
the red column tells you how often NU used each type of rush in this season total;
the lighter-red column tells you how effective each type of rush has been this season total;
the gold column tells you how often NU used each type of rush in the first six games of this season;
the lighter yellow column tells you how effective each type of rush was in the first six games of this season;
the darker blue column tells you how often NU used each type of rush in the last six games of this season; and
the lighter blue column tells you how effective each type of rush was in the last six games of this season.
I’ve broken it out into several sections for us to examine for the defense:
General Performance
Personnel/Play Type
Fronts/Boxes
General Rush/Blitzing
Coverage
Safety Alignment
Press/Coverage Rotation
Keep in mind that these figures aren’t adjusted for opponent strength; they’re just raw totals. The second-half numbers are predisposed to be worse, as they fully come against a Big Ten schedule, while the first-half data comes against non-conference opponents.
The tables containing the percentages ended up coming over quite small, but if you click on the image, it should pull up a larger, more readable version.
Let’s get started:
General Performance

A brief overview of the performance of the defense in the advanced metrics and efficiency numbers and situationally to set the framework before we get into the specifics of what Nebraska ran in 2024.
The advanced metrics would say the drop-off in the defense’s overall performance between 2023 and 2024 was only very slight. NU fell just eight spots nationally to 15th in SP+ defensive efficiency, moved down from 11th nationally to 16th in FEI defensive rating, and tied its 2023 ranking in FPI’s defensive metric. It’s overall success rate took a small dip, but its rates of explosive plays allowed and havoc plays created remained virtually the same.
The real difference among the things I chart for the 2024 defense was in yards per play. Nebraska allowed more than a full yard per play more in 2024 than in 2023 at 5.58, sliding almost 50 spots in the national rankings. And that was with it at 4.28 and fifth at midseason. NU would give up 6.87 yards per play in the back half of the year, which would rank 122nd nationally.
The four-game Indiana-through-USC stretch is largely to blame for the big drop in the YPP figure: Indiana went for 9.39 yards per play before garbage time, more than double what Nebraska had previously averaged allowing in the first six games; Ohio State went for 6.77; UCLA went for 6.85; and USC for 6.58. Nebraska also then allowed a poor Wisconsin offense to generate 7.60 yards per play, before holding Iowa to 3.88.
These are just raw totals unadjusted for opponent strength, which is likely why SP+, FPI, and FEI have a rosier view of the defense’s overall performance than yards per play does. Those metrics adjust for how good the offense you’re facing is. While the 9.39 vs. IU is atrocious even against a stellar attack, giving up the 6.77 to Ohio State and 6.58 to USC are viewed as good performances against top 15 offenses by the metrics.
In the situational numbers, NU got less efficient on early downs but slightly improved its performance in “money down” situations and long-distance passing downs. One other thing to note is that Nebraska’s third- and fourth-down performance in the second half of the season was much better than its performance on the first two downs; it was probably getting quite fortunate to get off the field in some of these situations in the final six games. Those point totals could have been worse.
Personnel/Play Type

One big thing we saw this year was more of a willingness by White to play different personnel groupings.
In his first year as DC, for nearly 93% of Nebraska’s plays White elected to play in Nebraska’s 3-3-5 base personnel of:
two edge rushers (one classified on the depth chart as a defensive end and the other a “JACK” linebacker);
two interior linemen (one classified on the depth chart as a defensive end and the other a nose tackle);
two box linebackers;
two outside corners; and
three safeties (one of whom functioned like a nickel, and another in a Rover who functioned like a third linebacker).
But in 2024, White had more players he trusted in more positions and got more creative with the personnel deployment. Base personnel usage in the first half of the year fell to around 75%, then dropped even further to 63% in the second half. It finished at 68%, almost 30 percentage points lower than in 2023.
His most common sub package was a “pass rush” personnel used in long downs and distances, where he took the nose tackle off the field, slid both defensive ends to interior spots, and brought on two designated pass rushers to play on the edge, typically Princewill Umanmielen and James Williams. This comprised 17% of Nebraska’s defensive snaps on the year and was NU’s most effective personnel grouping per the data at a 75% success rate.3
But he also more often used heavy personnels, either through taking a defensive end off the field to bring on a third tackle or taking a safety off the field to bring on a third true linebacker. That usage went from 1.2% in 2023 to over 13% in 2024. White notably used the three-linebacker heavy personnel look for 69.1% of Nebraska’s plays in the season finale against Iowa.
Usage of dime personnel — with six defensive backs on the field, instead of the usual five — was also elevated, from no use in 2023 to 1.5% usage in 2024. Though that was largely the function of one game: White used a specialty dime defensive look for eight plays against Colorado, then used it for just one snap in the season’s other 11 games (a third and 8 against Iowa in the second half).

There are also a couple interesting trends to note in the types of plays opponents ran against Nebraska, too. Most notably was Nebraska’s success against true passing plays early in the year, with a 71% success rate in the first six games. NU also kept up its elite run defense from 2023 in the first half, giving teams no reliable ways to move the ball, fueling that No. 1 SP+ ranking in the season’s first half.
But the passing defense’s performance fell off considerably in the back half of the year, with the success rate against true passing plays falling 15 percentage points from the stellar 71.9% to a fine/mid 56.4%, which, coupled with a slight dip in the run defense, now gave teams two ways to move the ball. That passing defense number is also made a little noisy by the Indiana game — Nebraska has just a 31.8% success rate in defending the Hoosier’s true passes — and strength of schedule — Indiana, Ohio State, and USC all finished as top 15 passing offenses, and NU had impressive 58% success rates against each of Ohio State and USC — but Nebraska also put up an ugly 50% success rate against an average UCLA passing attack and a 60% against an atrocious Wisconsin passing offense. So the second half’s passing D failures weren’t all on the strength of schedule.
It’s worth noting the defense’s overall success rate against passes did still finish slightly ahead of last year’s, even with the second-half drop off.
The other element of note here is how the NU defense performed against run-pass option plays. I wrote in the preseason that several teams down the stretch of the 2023 season found success with RPOs against Nebraska and worried they might be a prevalent and effective way for opponents to attack NU’s amoeba 3-3-5 structure in 2024. Both proved true: The rate of RPOs run against Nebraska increased from 13.7% in 2023 to 20.1% in 2024, and Nebraska’s success rate at defending them dipped from 62.2% last year to 49.6% this season. Every defense is going to be worse against RPOs than they are other play types — that’s in their “make the defense wrong nature” — but to fall off nearly 15 percentage points is a pretty massive dip. RPOs were the only method of play in which opponents outperformed NU’s defense on the season.
Fronts/Boxes
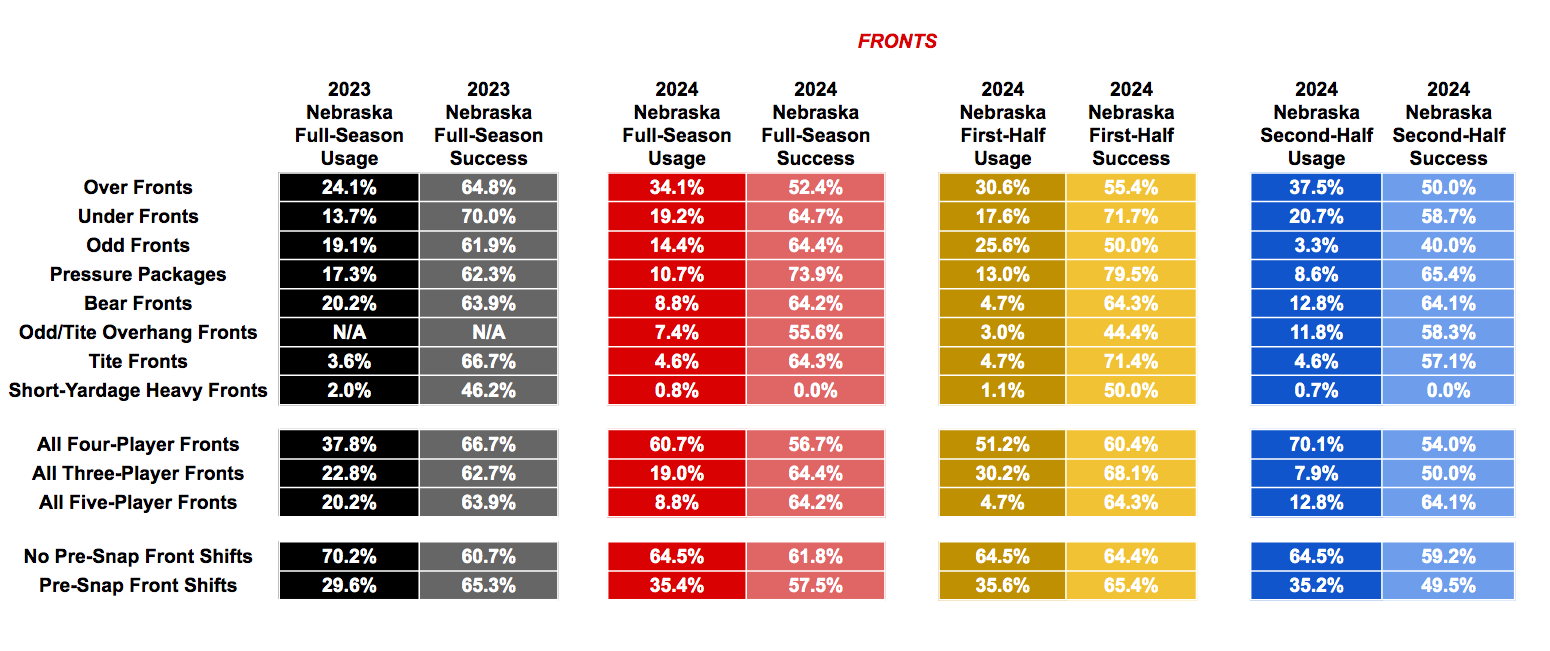
One of the bigger misconceptions from fans about Nebraska’s 3-3-5 defense is that it’s predominantly a three-player front defense. Over the last two seasons, Nebraska has far more often utilized an even front (four players) than it has the three-player looks the 3-3-5 is known for. It’s probably best, at this point, to classify it as a “multiple” front defense, or just a four-player front defense.
That move to four-player fronts only increased in 2024. NU was in a four-player front on 60.7% of its snaps, using the three-player fronts on about 19% of plays (almost identical to last season) and five-player Bear fronts on just 8.8% of plays (a big drop from last year’s 20.2%).4 And as Nebraska got deeper into Big Ten play, it almost never used the three-player fronts: Of Nebraska’s 115 three-player front snaps on the season, 21 came against UTEP, 16 came against Colorado, 19 came against Northern Iowa, and 15 came against Illinois — the first four games. After that Illinois Big Ten opener, NU would use just 44 snaps of the three-player looks in the remaining eight games. Thirteen of those 44 came against Rutgers and 11 more came against USC, meaning there was little to no usage of three-player fronts in six games NU played this season. You see that reflected in the second-half data, as NU’s three-player front rate is just 7.9%.
The effectiveness of NU’s four-player looks did drop off significantly, 10 percentage points down from NU’s 66.7% success rate in 2023. This was a more consistent problem throughout the year, though, than some of the other poor data points that were just affected by the Indiana through UCLA stretch. NU was very bad out of the look in the Indiana game (a 33% success rate for Nebraska in four-player fronts), but it had seven total games this season total in which its success rate in four-player fronts was lower than 60%. This wasn’t the same consistent success we saw out of that front in 2023, or even close really.
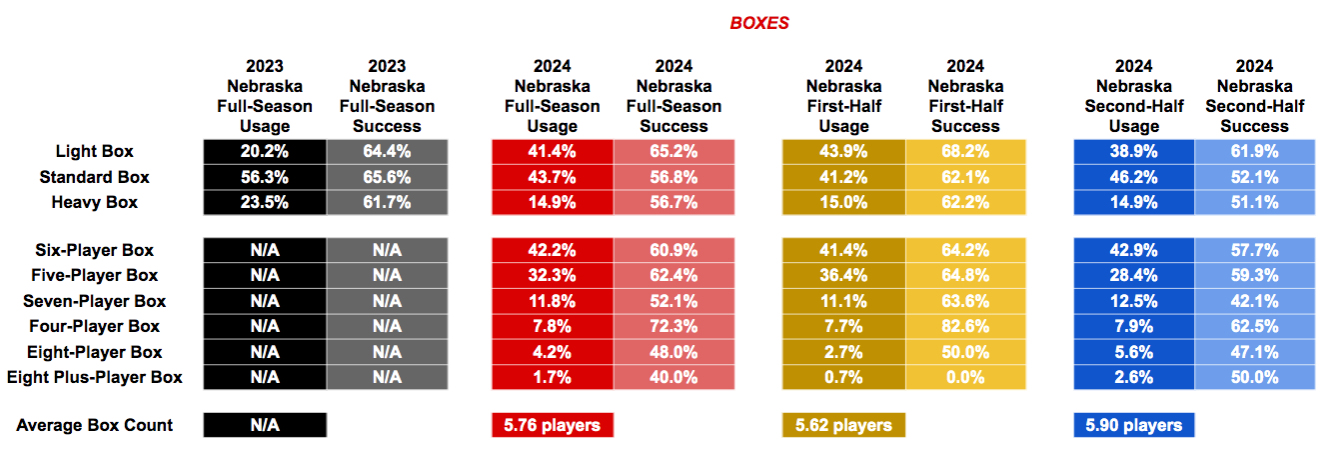
The box data stayed consistent throughout the whole year: NU was around 40% usage in each of light or matching boxes, with the remaining 20% of snaps in a heavy box.5 The distributions of the individual totals, too, stayed remarkably sticky throughout the whole season. And all three box types took similar dips in the second half of the season — Nebraska was just worse in all three types of boxes in the final six games as it faced the teeth of its offensive schedule.
The distribution did differ a bit from last year, though. NU more than doubled the rate it played with a light box — 20.2% to 41.4% — from 2023 to 2024, and actually very slightly improved its effectiveness, with the success rate raising 0.8 percentage points. This is an indication, to me, that White felt more comfortable feeling his front seven players could stop the run with less help. Playing more often in light boxes is usually a sign that the DC feels comfortable with the one-on-one matchups and doesn’t feel the need to throw bodies at the line to keep the run game in check.
Nebraska’s average box count did rise slightly in the second half of the season — 5.9 players compared to 5.6 in the first six games — but that rise can also largely be attributed to Nebraska playing three teams in UCLA, USC, and Iowa that either had strong running games or often utilized heavy offensive personnels that NU had to match.
General Rush/Blitzing

One of the big question marks entering this season was if Nebraska could do a better job generating a pass rush with its base four-player set. NU got good pass rushing production from its interior players in Nash Hutmacher and Ty Robinson in 2023, but it had virtually no real one-on-one sack or pressure threat from its edge defenders. That forced White into blitzing more, which took players out of coverage and opened lanes for opposing quarterbacks to hit.
The data would indicate, yes, Nebraska was able to make big strides with its four-player rush. NU’s overall rate of rushing four increased by nearly 20 percentage points, and the rates in which it rushed five players fell from 32% to 24% and the rate in which it rushed six or seven players fell from over 11% to a little over 6%. And the usage of the four-player rush went up specifically in the second half of the season, rising to 63.6% of snaps.
NU was able to rely on its four-player rush more because of big strides made by Umanmielen and Williams as edge threats; Williams finished seventh in the Big Ten among qualifying edge rushers in Pass Rush Win Rate at 18.5% per Pro Football Focus, and Umanmielen was two spots lower at 17.6%. And Williams finished first in the conference and Umanmielen 11th in PFF’s overall Pass Rush Productivity stat, a measure that combines a player’s sacks, hits, and hurries relative to how many times they rush the passer. Those two will be big losses, no matter what the message board recruiting guys believe, and losing them could make it hard for NU to rely as much on the four-player rush next season. And we already have some evidence in a high blitz rate in the Pinstripe Bowl that Nebraska wasn’t able to rely on its base rush as much without those two coming off the edge.
2024 BOWL RECAP: New York Noise

It’s increasingly hard to tell what is real about bowl games in this new era of college football.
One other interesting note in the general rush is that Nebraska used significantly less of the three-player rush package — dropping eight into coverage — in the second half of the year, with it falling from 16% usage in the first six games to 4.3% in the back half of the year. That led to it finishing six percentage points lower than it did in 2023. That was also probably affected by the offensive matchups Nebraska faced, but White also seemed to need to use Drop 8 less this year to get off the field on third downs with the pass rush improving.

For NU’s stunts — a defensive tool in which linemen loop around one another into different gaps than they were lined up in pre-snap — the data largely stayed the same as it has for all of White’s tenure, except for a rise in stunting in the second half as Nebraska contended with some better rushing offenses and lines that it couldn’t beat one-on-one as easily. DC’s often turn to stunting in an attempt to generate confusion to spring rushers free or generate havoc when they feel the d-line is less likely to get individual wins.

Further supporting the growth of the four-player rush is that Nebraska’s overall blitz rate dropped about five percentage points, and really fell off in the second half of the year, decreasing 12 percentage points to 30.5%.6 While it ended up close in the full-season data, Nebraska’s plays without a blitz were far more effective in the second half of the season than its plays with a blitz, leading White to do it a lot less. Rushing four was largely what he relied on in the final six games. Overall, Nebraska’s blitzes finished six percentage points lower in success rate in 2024 than they did in 2023. It was a good thing the base rush got better, or NU might have been in trouble.
Where Nebraska blitzed was a bit different this season: In 2023, the pressures came almost totally in the A gaps (between the offensive center and offensive guard) and the C gaps (outside the offensive tackle but inside a potential tight end). In 2024, it was a much more even spread, with the A, B, and C gap blitzes all being within a percentage point of one another.
Coverages
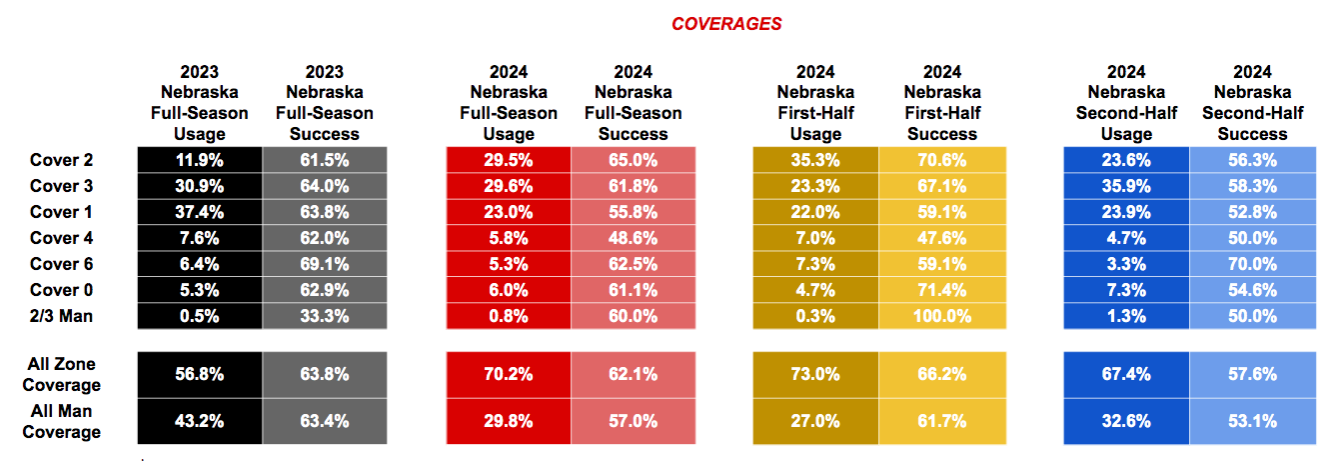
The arrival of new secondary coach John Butler — now the defensive coordinator after White’s departure for the Florida State job — brought some pretty massive shifts in the types of coverages Nebraska chose to run.
In 2023, Nebraska was playing Cover 3 (a single-high safety, three-deep zone coverage) or Cover 1 (a single-high safety, single-deep man coverage) on over two-thirds of its snaps, with a smattering of other zone looks sprinkled in. It was also not far from being split dead even in its overall usages of zone and man (56.8% to 43.2%).
But Butler, who came from the zone-heavy Buffalo Bills of the NFL, brought with him an increased reliance on zone looks, and in particular one specific zone look: Tampa 2. Tampa 2 is a variation of Cover 2, a two-deep zone coverage with a middle robber players that’s having a sort of football renaissance after its heyday with Tony Dungy’s Tampa Bay Buccaneers, and is being popularized by several 3-3-5 defensive coordinators. Before Butler’s arrival, Nebraska played all forms of Cover 2 at about 11.9%, but that figure jumped to 29.5% in 2024, just a few plays away from being Nebraska’s most-used coverage. It was especially prevalent in the first half of the season, with Nebraska using it on 35.3% of its snaps; 15 percentage points higher than any other coverage. Cover 2 was also Nebraska’s most effective look throughout the year, with a 65% success rate.
Cover 3 — which with its single-high safety structure allows you to put another defender in the box against the run — did outpace the Cover 2 and two-high usage in the back half of the season. But that, like the front and box data, was also largely related to NU playing several good rushing teams and teams that used heavy personnel in the back half of the season. Nebraska played Cover 3 on 56.8% of its snaps against Ohio State, 46.3% against UCLA, 36.4% against USC, and 36.6% against Iowa — all teams with either elite rushing attacks/personnel or that use pro-style offenses featuring high use of multiple tight ends or fullbacks. So that Cover 3 usage increase was, in part, dictated by matchups. Cover 2 was what I would call NU’s “main coverage.”
The other thing to note here is the overall split of man to zone coverages and the success out of them. Whereas Nebraska was close to 50-50 in zone-man usage in 2023, this year it went something closer to 70-30 zone to man. The effectiveness of man coverage also dipped — plays using man coverage finished with a 57% success rate on the season, and a specific 53% success rate in the second half of the year.
Both of these data points — using more zone coverage and a decrease in the effectiveness of man coverage — tell me that the defensive staff just didn’t think Nebraska’s corner play was as good this year as in 2023, especially in the second half of the season. Teams with bad or non-elite corners tend to play more zone — it’s a way to hide poor ability to actually cover one-on-one because you’re just saying, “Defend this one specific space on the field.” Bad corners can still be bad in zones, but it’s usually an easier lift than saying, “Stay really, really close to this receiver wherever they go.” That’s especially true in Cover 2, where the corners are playing the flats close to the line of scrimmage.
Some of this was for two obvious reasons — Nebraska’s No. 1 CB Tommi Hill got turf-toe in the first three games and hardly saw the field the rest of the year, and other presumed starter Blye Hill got hurt in the spring game — but this data supports that the backups weren’t trusted by the staff. So to does NU yo-yo’ing Malcolm Hartzog Jr. and Marques Buford Jr. back and forth between outside corner and nickel safety the whole season trying to cover for those failings. I’m reminded of the UCLA game where Hill and Hartzog were both out with injury and NU inserted Jeremiah Charles in on the outside, to promptly watch him give up three big catches on the opening drive in man coverage and not play again.
This could also be the reason we’ve seen such a big focus on NU adding defensive backs in the transfer portal.
Safety Alignment
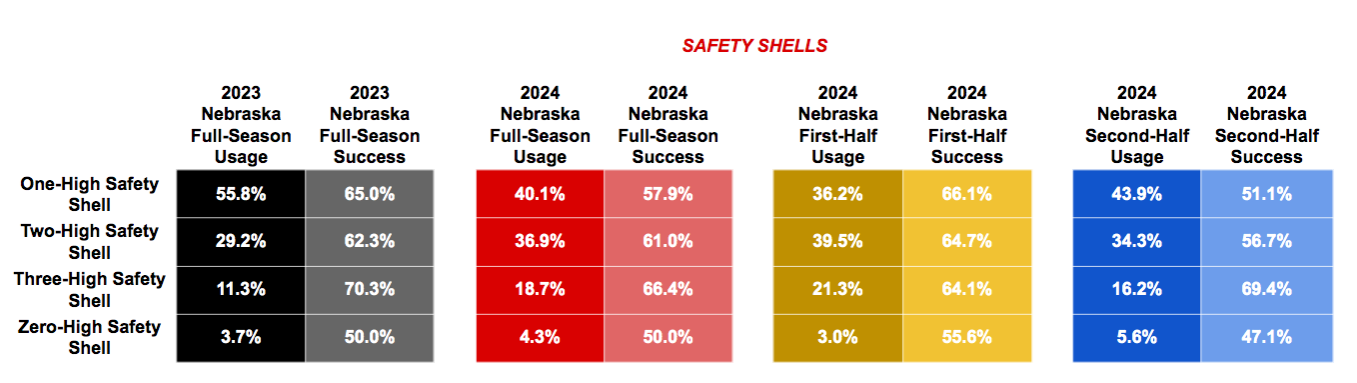
With use of Cover 3 and Cover 1 — single-high safety coverages — decreasing, and Cover 2 — a two-high safety coverage — increasing, we naturally saw a rise in two-safety deep pre-snap shells, with their use going from 29% of snaps in 2023 to 36.9% in 2024. Nebraska actually played more two-high than single-high in the first half of the season, at 39.5% to 36.2%, before the run-defense-oriented shift back to Cover 3 in the second half of the season.
But the most interesting data point here is the increase in true three-safety looks. In 2023, Nebraska’s version of the 3-3-5 was a pretty classic, old-school, Rocky Long version of the scheme, with three “safeties” on the field but one essentially functioning like a traditional nickel or the Rover position spending a bunch of time as the de-facto linebacker. It only ran three-high structures on about 11% of plays.
But in 2024, NU slightly shifted more to a new-school version of the scheme similar to those developed by John Heacock at Iowa State or Jim Knowles at Oklahoma State and Ohio State that prioritize playing like a true three-high defense more often. The Rover began to play less often like a backfilling linebacker and more like a true middle safety. Nebraska went above 21% usage of three-high structures in the first half of the year, almost doubling the total usage from 2023. The number fell off a bit in the second half of the year as NU had to contend with some of those stronger run games and heavier personnels, as I’ve discussed, but for the year it still finished at 18.7%, an increase of more than seven percentage points. The three-high structures were wildly successful all season, too, finishing as Nebraska’s best structure by success rate (66.4%) and keeping up a 69% success rate in the final six games while both single-high and two-high took significant dips.

The move to more three-high and two-high shells also changed how the individual safeties played. One often still just played like a nickel (that was Hartzog through much of the season, and occasionally Buford when Hartzog was forced to play outside corner). And one just played like a true strong safety, splitting time deep or walked down in pretty traditional alignments (that was DeShon Singleton for much of the season).
But we saw a complete change to the use of the Rover position in 2024. The Rover — Isaac Gifford for most of the year — spent most of 2023 as a sort of quasi-safety/linebacker hybrid, splitting his time about evenly as a safety and in the box as a linebacker. But in 2024, that shifted wildly, with Gifford playing deep on about 80% of snaps. He played deep in a lot of ways, too: as that middle safety in the three-high looks coming down as the hole player in Tampa 2, as a deep-half player in Nebraska’s two-high looks, as the deep middle defender in Cover 3 sorting out crossing routes, and as the deep-cap player over the top of man coverage in Cover 1.
All of this is to say: We largely saw Isaac Gifford switch from being a de-facto linebacker/box player into being a traditional free safety this year, with very few hiccups. Kind of insane and underdiscussed!
Press and Coverage Disguise
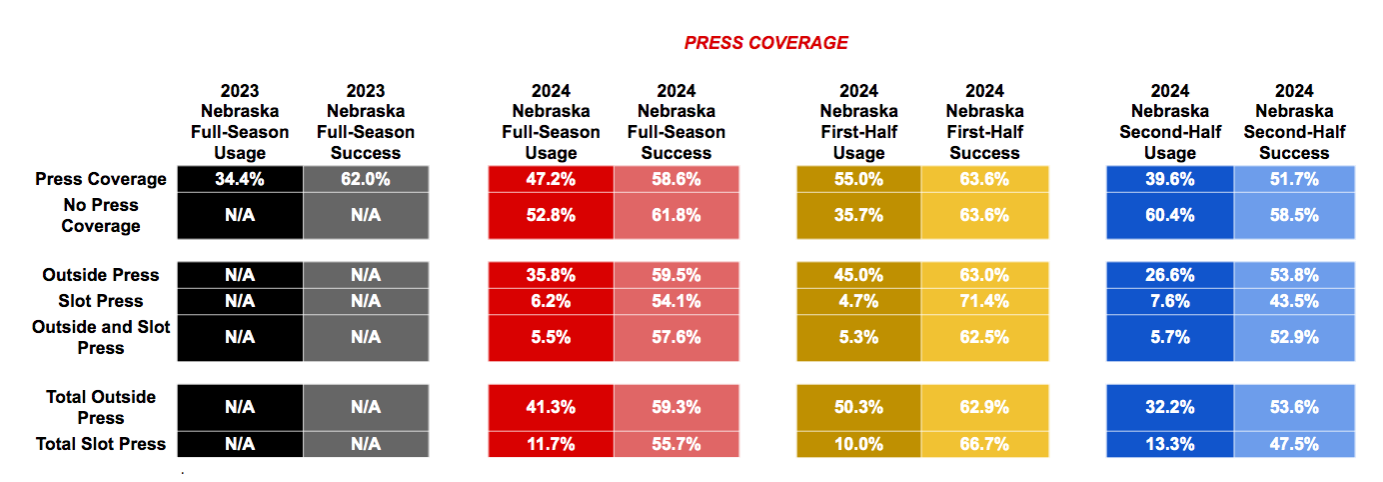
Also supporting the idea of diminished corner play on the outside in the second half of the season is Nebraska’s diminished rate of press coverage. NU used press — where the defensive back is tight to the line of scrimmage and trying to disrupt the receiver’s route off the ball — somewhere on the field on 55% of its snaps in the first half of the year, and 50.3% of its snaps had an outside corner pressing a receiver. But in the final six games, after Tommi Hill’s injury, the overall press rate dropped to 39.6% and the outside press rate dropped to 32.2%. The effectiveness of plays with press coverage also fell off majorly, going from a 63.6% success rate in the first half of the season to a 51.7% success rate in the second half, significantly worse than non-press plays (58.5%), whereas those had virtually identical effectiveness in the first half of the year.
Press is a more high-risk, high-reward strategy you deploy when you have corners you trust with good technique to disrupt the routes but also not get blown up at the line and beaten down the field for an explosive play. That it was used less is just a further sign Nebraska’s staff didn’t trust the options it had available to play.
Nebraska, on the whole, did use more press overall this season than it did last year, though I didn’t keep detailed charting of the types in 2023.
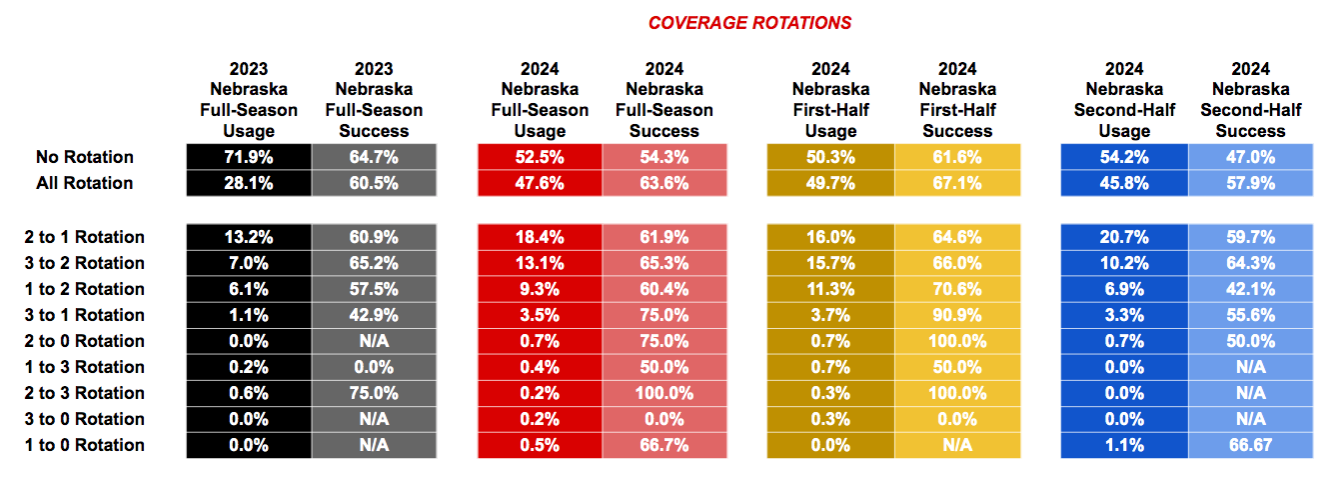
On the back-end, Nebraska also rotated its safeties more in 2024, using some sort of coverage disguise or contour on 47.6% of its snaps, nearly 20 percentage points higher than the frequency in which it rotated in 2023. The rotations were also a lot more effective — a 63.6% success rate on plays with rotation and a 54.3% success rate on plays without it — which is also reflected in the first-half and second-half numbers.
Nebraska really only significantly used four types of coverage rotation all year:
2-to-1 rotations, where Nebraska started with two safeties deep pre-snap and brought one down to play a single-high coverage (18.4% of plays);
3-to-2 rotations, where Nebraska started with three safeties deep pre-snap and brought one down to play a two-high coverage, usually when it brought Gifford down as the hole player in Tampa 2 (13.1% of snaps);
1-to-2 rotations, where Nebraska started with one safety deep pre-snap and dropped one from the box back to play a two-high coverage; and
3-to-1 rotations, where Nebraska started with three safeties deep pre-snap and brought two down, usually with Gifford playing over the top and Hartzog and Singleton coming down.
The rest of the rotations happened at negligible rates and were possibly/probably just single-game or alignment checks based on formations than real designed rotations.
Thanks, as always, for reading. This same exercise for Nebraska’s offense will be out next week. This post was free to the public, but the offensive post will be behind a paywall. If you aren’t a paying subscriber and are interested in receiving more detailed, researched writing like this, I’d appreciate a subscription. For $5 a month, you’ll get access to all of my offseason content, plus all the game posts in the archive from this year and in the upcoming 2025 season.
The definition of Success Rate I use, from Action Sports Network: “Success rate is an advanced metric in football that measures efficiency, but with the important context of down and distance considered. A play is defined as successful for a defense if it prevents a gain of at least 50% of the yards required to move the chains on first down; 70% of yards to go on second down; and 100% of yards to go on third or fourth down. To calculate success rate, divide the number of successful plays (as defined by down and distance above) by total plays.
I apologize for the strange color selections; I was trying to make each data column stand out.
Though there is some noise to that number — the package was seldom used outside of long second and third downs, which are difficult for the offense to have “successful” plays against, by definition. It was still very effective, but this is one example of where success rate as a stat is probably overrating how well something performed, though technically you could say it isn’t because the pass rush package “did its job,” so to speak.
The remaining percentages of snaps not included in those three all came from pressure package looks or heavy/goalline fronts.
I chart a light box as one in which the offense has five or fewer defenders inside the tackle box to five yards depth or is playing at least one defender down compared to the offense’s potential blockers (including tight ends and fullbacks), a standard/matching box as when the defense equals the number of the offense’s potential blockers inside the tackle box to five yards depth, and a heavy box as one in which the offense has eight or more defenders inside the tackle box to five yards depth or is playing at least one defender above the offense’s potential blockers.
Blitz rate differs from the pure rush numbers slightly in the way I track it. Places like PFF just say anything over four rushers is a “blitz,” whereas I try to sort it out a little more accurately into true blitzes vs. not. For example, if you line up in a five-player Bear front and rush all five guys, PFF would say that’s a blitz, but it’s really not your DC sending extra rushers — you just rushed all your down linemen. Likewise, if you lined up in a three-player Odd front and also rushed a fourth player from the LB or DB level, PFF wouldn’t count that as a blitz because only four players rushed, when it really is a blitz because you brought an unexpected player from the second or third level.