


TENDENCIES: 2024 Full-Season Offense, Part I
Evaluating the alignment, formations, personnel, tempo, motion and shifting, and play types of Nebraska's offense in 2024

This is the second part in the annual breakdown of Nebraska’s formational, operational, and play tendencies and their success. The first part, focused on the defense, went up last week and is available for free. There’s a ton of granular data I track for the offense, so in the interest of not writing The Odyssey-length posts every week, I’ve split the information on the offense into two parts. This first post will cover the offense’s alignment, formations, personnel, tempo, motion and shifting, and play types. The second post, out next week, will cover specific data on the run and pass games.
Nebraska’s full offensive season, to me, can be broken up into three distinctive phases/eras:
Phase/Era One, constituting the first five games, NU’s offense performed largely like a top 40 to 60 unit behind the switch to the “49ers”-style system and the playmaking of freshman quarterback Dylan Raiola. In these games — UTEP, Colorado, Northern Iowa, Illinois, and Purdue — Nebraska largely faced a slate of poor defenses1 and used its talent advantage, gameplan surprise from the new scheme, and out-of-structure playmaking from Raiola to put up solid production.
Phase/Era Two, in the next four games — Rutgers, Indiana, Ohio State and UCLA — opposing defenses got enough film and prep to adjust to Nebraska’s new offense and came in dialed in on what Nebraska was running with the help of extra prep time2 and stacked the box to stop Nebraska’s ground attack. Needing plays in the passing game to force the defenses out of the heavy boxes, the pure playmaking Raiola relied on/got away with early in the year dried up as he faced a slate of much better and more talented defenses, and teams then keyed in on Raiola’s inability as a processor and spammed him with sim pressures and post-snap coverage changes, which melted his brain. Nebraska’s offensive production in this stretch was among the worst in the nation, as the team’s advanced stats profile plummeted and coordinator Marcus Satterfield lost his job.
Phase/Era Three, in the final three regular-season games and the Pinstripe Bowl — against USC, Wisconsin, Iowa, and Boston College — new offensive coordinator Dana Holgorsen slimmed down the playbook and introduced more quick game, more motion, and more variety to the offense, which kept defenses more off balance and improved Raiola’s processing and ability to get the ball out fast against the blitz, which led to lighter boxes and more running game success. The production here was very improved and came against a very tough defensive slate — a genuinely impressive four-game stretch of outputs, considering the quality of defenses faced.
That there were sort of three different “offensive seasons” within one for Nebraska makes it hard to evaluate the bigger picture. But splitting the data into full season, first half, and second half can sort of let us see this picture a bit more clearly. Much of the data in the first half of the year actually looks quite good! But we can also see the drag of the “second” era in a lot of the second-half numbers, as well as some of the changes Holgorsen made situationally to try to arrest the slide. I chose not to pull out the specific data for Holgorsen’s games in this post; I’m planning on evaluating that as its own individual post later in the offseason.
Let’s get started. Below is a brief explainer of how to understand the charts in the post for any new readers (and is redundant if you read it for the defensive post).
EXPLAINER
During the year, I chart various atomized elements of Nebraska’s offense and defense, from how they line up to what they run. I also chart how effective each of those elements is through a popular metric called “success rate.”3 All of that data has been tallied and presented here as percentages of usage on Nebraska’s total offensive plays run and their success rate on plays using that element.
Here’s a quick guide on how to understand/read the charts listed here:
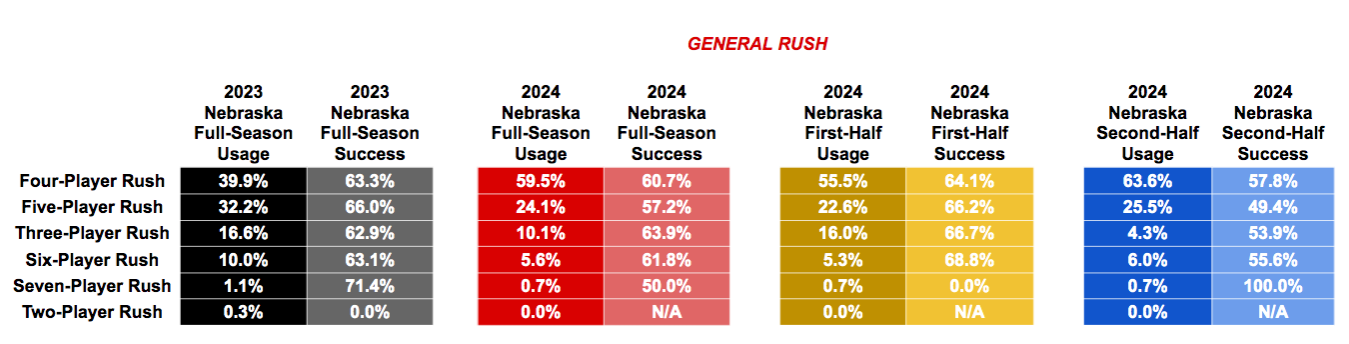
This is just one example from the defensive post. The first two columns on the left in black and grey are the data from last season, with the black the usage rate (how often Nebraska used said element as a portion of its total plays) and the grey the success rate (how often said element is working). The two columns to the right in red and lighter red are the full-season data from this year, with the dark red the usage rate and the lighter red the success rate. The gold column and yellow columns are the isolated data from the first six games of the season (UTEP, Colorado, Northern Iowa, Illinois, Purdue, and Rutgers), and the blue columns are the isolated data from the final six games of the season (Indiana, Ohio State, UCLA, USC, Wisconsin, and Iowa).2 This data does not include the bowl game, as I didn’t want to taint the data set with information from a game I essentially view to be an exhibition contest with opt-outs.
So, to be specific for the graphic above:
the black column tells you how often NU used each type of rush in 2023 total;
the gray column tells you how effective each type of rush was in 2023 total;
the red column tells you how often NU used each type of rush in this season total;
the lighter-red column tells you how effective each type of rush has been this season total;
the gold column tells you how often NU used each type of rush in the first six games of this season;
the lighter yellow column tells you how effective each type of rush was in the first six games of this season;
the darker blue column tells you how often NU used each type of rush in the last six games of this season; and
the lighter blue column tells you how effective each type of rush was in the last six games of this season.
I’ve broken this out into several sections for us to examine:
General Performance
Alignment and Formations
Personnel
Pre-Snap Operation
Play Type/Distribution
General Performance

There is some pretty astonishing discrepancy between what SP+ says about Nebraska’s offense and the other two statistical services I use — FEI, from Brian Fremeau, and FPI, from ESPN — say: Both of the latter services had the unit in the 40s nationally, while SP+ had it barely breaking 100th. Statistical services can disagree depending on what their formulas entail or value, but units and teams are largely found in the same ballpark. To be 50 spots apart is quite a, “What the hell?”
All three services adjust their rankings to consider the quality of a team’s opponent — meaning your ranking will be adjusted depending on the level of competition you face — so the only real factor I can think of that would lead to such a discrepancy is that Nebraska’s strength of schedule down the final six games of the year just goosed their numbers in the FEI and FPI formulas. NU played a brutal defensive schedule down the stretch: It faced the No. 1 overall defense in SP+ defensive rating in Ohio State, the No. 7 defense in Iowa, the No. 10 defense in Indiana, and the No. 28 defense in Wisconsin, and both USC (46th) and UCLA (48th) both also finished as top-50 units. For what it’s worth, FPI’s unadjusted numbers had Nebraska’s offense ranking in the 60s, so the schedule strength is boosting them over 20 spots. A ranking in the 60s seems much more fitting. From the eye test, NU’s performance seemed closer to that or the 94th-best offense than the 41st best.
What isn’t really arguable is that Nebraska’s offense did get better under the hood in 2024. While it wasn’t starting from a place that was difficult to improve upon, most teams playing a no-experience teenager at quarterback facing one of the toughest defensive slates in the sport don’t usually see their numbers get better. But NU’s did:
Its overall success rate was up eight percentage points;
it generated a higher percentage of explosive plays while greatly limiting how often it had negative plays (14.4% havoc play allowed rate in 2023 to 10.0% in 2024);
its points per drive improved 30 spots in the national rankings;
it got significantly more efficient on first, second, and third downs;
it faced an average third down over a yard-and-a-half shorter than last year; and
it was more efficient on both passing downs and in short yardage situations.
Some of those numbers still weren’t nearly good enough if you’re a team with playoff aspirations — especially as the sport shifts to a more offense-centric model — but developing, young units like Nebraska’s offense in 2024 want to see steady progress from previous years. That did happen. What remains to be seen is if NU takes these better numbers and makes the leap into actual good numbers next season, which will be a harder act.
Alignments and Formations

Here is where we can see a pretty stark contrast between Satterfield’s operation of the offense and Holgorsen’s.
In the first half of the season — all Satterfield’s design — we see an offense that spends 25% of its snaps under center, either in singleback looks or in the I-formation, and one that is using condensed receiver splits (when the wideouts are aligned closer or tight to the offensive line, leaving space between the widest player and the sideline) on almost 38% of plays. We also see almost no specialty formations like unbalanced, empty, two-back, extra offensive line, or Wildcat looks. While NU was still spending plenty of time in the shotgun, the offense was more heavily utilizing the under-center and condensed run-and-boot game. Like you’d see out of an NFL team from the Shanahan/McVay tree.
In the back half of the season’s games — three of which were Satterfield’s and three of which were Holgorsen’s — we see the under-center rate drop from 25.0% to 14.2% and the condensed rate fall from 38.0% to 21.6%, and the use of specialty formations rises across the board. Holgorsen still chose to dabble a little in that NFL “condensed-zone-and-boot” style, but he cuts down on its usage significantly to introduce more plays truly out of spread-shotgun looks. He more than tripled Nebraska’s use of two-back sets — which generated several big plays in the key win against Wisconsin — and he more than quadrupled the use of Heinrich Haarberg in the Wildcat.4 All of this served to make Nebraska’s offense less predictable and static, introducing new specialty elements teams had to practice and prep for.
Keep reading with a 7-day free trial
Subscribe to Black 41 Flash Reverse to keep reading this post and get 7 days of free access to the full post archives.