

TENDENCIES: 2025 Offense
All of the data I tracked on how Nebraska’s offense lined up and operated — and how successful all of those elements were

Plenty of major stories have developed with Nebraska football in the past few weeks, but this newsletter’s focus is still on what it has always been: Throwing percentages at you.
This is the first of my yearly tendencies posts, where I present all of the data I charted during the season. This one is focused on the offense; the defensive version will come later.
These are among my favorite posts to write each year because they present us the clearest picture of what Nebraska actually was during the season, devoid of game-to-game narrative or emotion, and because they often lead me in surprising places: Most of the data and stats in here track with the eye test of watching the film, but there are also almost always discrepancies between something I thought was a strength that comes out as mediocre or weak, or vice versa. This year, it was the interior offensive line in run blocking: They looked solid — to even good — on film in most games, but tallying up the charting shows more busts than I had thought coming from the interior. These numbers aren’t gospel to be taken as the absolute truth of the 2025 Nebraska football season — just like film isn’t — but seeing discrepancies between seasonlong numbers and film can make me reconsider my priors and opinions on what I just spent 12 games watching. Plus, it’s just fun to see what NU was running and how effective it was, all in one place.
This post will delve into the offense. The unit was predicted to take a big jump heading into the season, and I think this post will spell out that we did see some fairly significant improvements — even if the offense didn’t make a jump into elite as some thought it might. There was quite a bit of growth in the passing game and improved quarterback play and changes to the types of concepts Nebraska used, plus a midseason change to the running game by the coaching staff that paid major dividends. All of that is detailed in this post.
Here’s how it works: Each year, I chart dozens of individual elements from Nebraska’s offense and defense, from formations to play types to what’s happening pre-snap. I also track how successful each of those elements is by “success rate,” an efficiency metric you can read more about here. Success rate just measures efficiency, not explosiveness, making it an imperfect measure of how much something is “working” — an offensive element could have poor efficiency but could generate lots of yardage off explosives, making it valuable. But, while imperfect, I think success rate is the best way to present a single number for how good or bad something performed for Nebraska over an entire season.
I present all this data for the full season, with one column on the “usage rate” — i.e., how often Nebraska did something this season — and a column on the “success rate” — i.e., how efficient it was. I also have the same in splits for the first and second halves of the season, and the same data from past years for comparison. I have included 2023 and 2024 as the comparison years, so that we can see how much growth Matt Rhule has made in his three years as coach.
Here’s an example:
So, in the graphic above:
The darker red column would tell you how often Nebraska used an element during the whole 2025 season;
the lighter red column would tell you how well that element performed by success rate during the 2025 season;
The darker gold column would tell you how often Nebraska used an element during the first half of the 2025 season;
the lighter gold column would tell you how well that element performed by success rate during the first half of the 2025 season;
The darker grey column would tell you how often Nebraska used an element during the second half of the 2025 season;
the lighter grey column would tell you how well that element performed by success rate during the second half of the 2025 season;
The darker orange column would tell you how often Nebraska used an element during the 2023 season;
the lighter orange column would tell you how well that element performed by success rate during the 2023 season;
The darker blue column would tell you how often Nebraska used an element during the 2024 season;
the lighter blue column would tell you how well that element performed by success rate during the 2024 season. 1
I tracked many new things this year that I didn’t in past seasons, so if anything in the chart has an “N/A” for an entry, that’s something new I started tracking and don’t have data on for past seasons (or is not possible for me to tabulate).
Some of the charts ended up being small image sizes on the webpage, but if you click on the individual image it should bring up a larger version that is more easy to read on your web browser or phone.
I realize this is a 9,000-word post mostly about percentages, which will be a bit of a slog to get through. I just chart a lot of different elements, which makes a lot to write about. The bowl recap and defensive tendencies post won’t be out for a couple of weeks, so I released this now so everyone could take their time reading it.
I’ve broken this up into several sections and subsections:
Performance (General Performance and Situational Performance of the offense as a whole);
Alignment/Pre-Snap Operation (Alignment and Formations, Specialty Packages, Bunches/Stacks and Condensed Looks, Personnel, Tempo and Motion Rate, Motion Type, and Motion Player);
Play Data (Play-Type Distribution, Formational Play-Type Distribution, Opponent Box Data)
Run Game (Optionality Data, RPO Type, and Run Concepts)
Pass Game (Pass Type, Play-Action, Pass Protection, and Pass Concepts); and
Player Performance (QB Performance, Run and Pass Blocking, WR Open Rate).
Let’s get started:
PERFORMANCE
General Performance
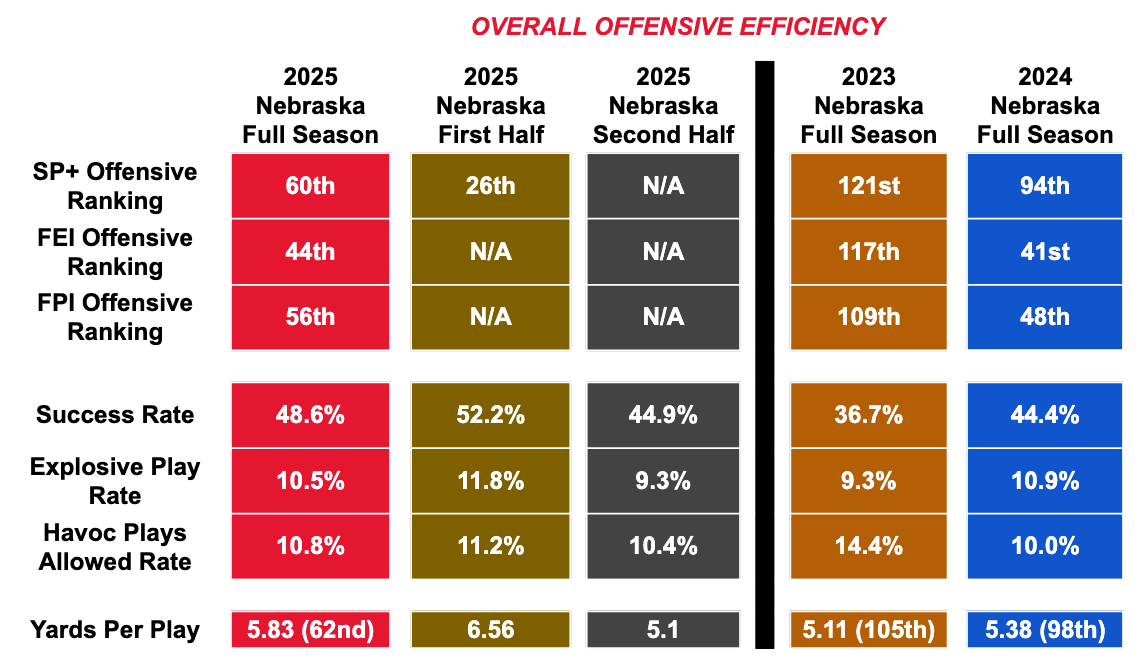
Nebraska’s offense probably didn’t improve in 2025 as much as predicted by many before the season, but by pretty much every metric, it did significantly improve.
In the more holistic predictive measures, it was up nearly 30 spots in SP+ offensive rating and was only slightly worse than its FEI and FPI rankings from last year.2 NU was 94th nationally in the SP+ offensive rankings last year, so I found some of the preseason predictions of an elite or top-five national unit outlandish, but I also think it’s fair to believe this should have been better than the 60th best offense in the country. That was probably a poor result for the level of talent at the skill players on the unit. It should also be noted that the offense was at 42nd nationally in SP+ offensive rating through Dylan Raiola’s starts (and the team was at 28th in overall SP+ ranking). But the three games with TJ Lateef starting were cumulatively poor enough to drop NU down to the 60th spot (and 46th as a team). So with Raiola, SP+ would say NU would be expected to have about a top 40 national offense (probably more in line with a reasonable preseason prediction), and with Lateef it would probably be more comparable in performance to the offensive output we could expect in 2024. SP+ adjusts for quality of defense, so that wasn’t affected by Nebraska playing two good units in PSU and Iowa in that final stretch.
In the isolated stats, Nebraska’s overall success rate on offense was up 4 percentage points from last year and 10 percentage points from 2023 and way up in average yards per play, with most of the improvements being driven by the first half of the year and falling off in the back half of play against a slate of only Big Ten teams. The 52% success rate in the first six games was quite good for any offense; its 44% in the final six games was about even with what we got last year. The 2025 team’s overall explosive play rate was also in line with 2024, though it should be noted the explosives also did dry up pretty significantly in the second half of the season, even with Emmett Johnson breaking off his long runs, as the offense went away from true dropback passing and more toward RPOs and short throws (more on that in later sections). NU also did allow slightly more negative “havoc” plays this year — no surprise to anyone who watched the offensive line in pass protection.
Situational Performance
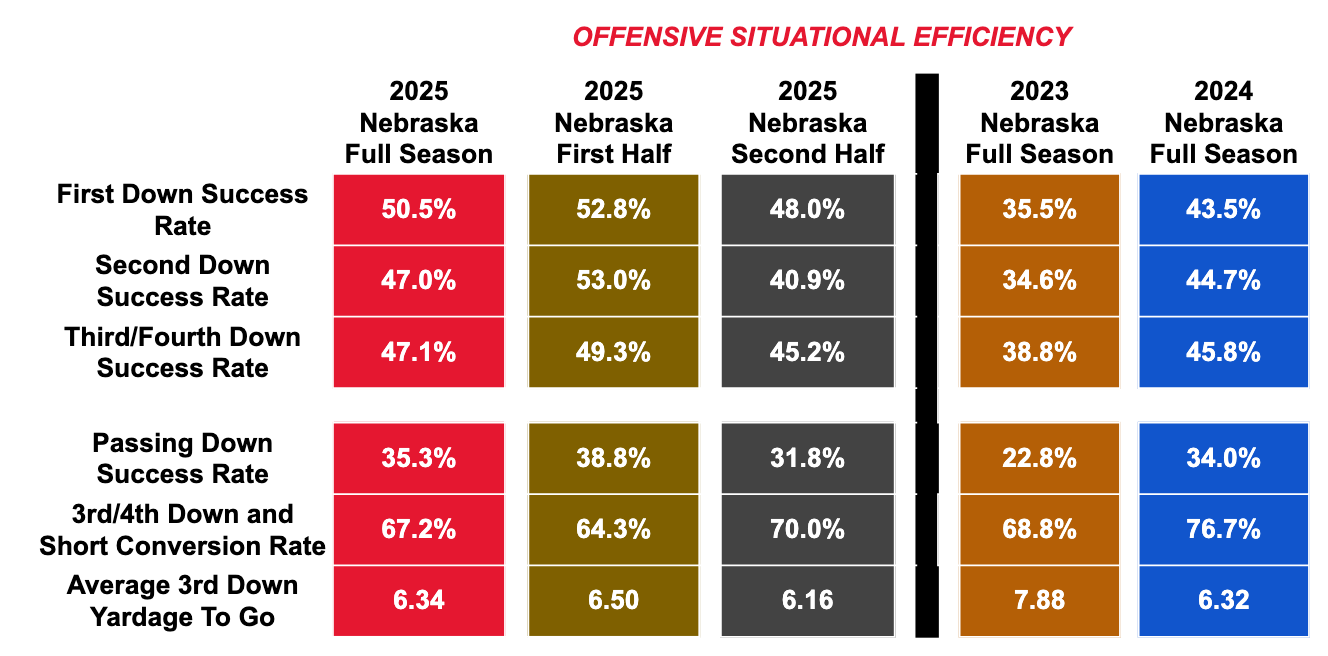
Situationally, the offense was also more efficient on all three downs this year, including much better on first downs. But it didn’t improve at all from last year in “passing situations” (second downs of 8 yards or longer and third and fourth downs of 5 yards or longer). It also was decidedly worse in short yardage (3 yards or less) on third and fourth down than last year. Nebraska was quite good at converting in those situations in 2024, with Dante Dowdell one of the better backs in the country at powering through or over the line. If Johnson struggled anywhere this year, you could say he wasn’t as impactful as that short-yardage power runner, and NU’s short-yardage conversion rate went back to around where it was in 2023.
ALIGNMENT/PRE-SNAP OPERATION
Alignment and Formations
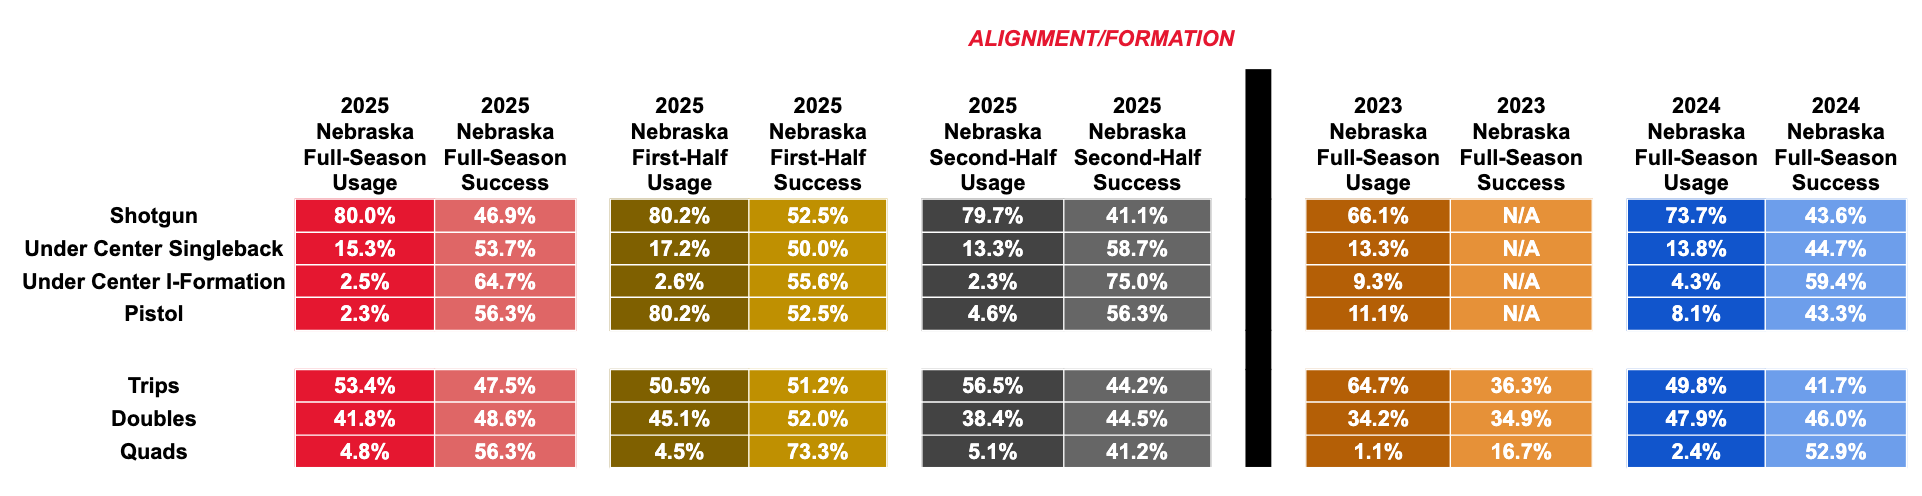
Nebraska migrated more into the shotgun in 2025 than in past seasons under Rhule — not surprising given new OC Dana Holgorsen’s spread offense reputation — but also upped its total rate of plays under center, which probably did come as a surprise. Nebraska topped 80% operation from the shotgun, 7 percentage points higher than last season and much higher than 2023’s 66%. But it also spent more time in one-back under-center looks than the past two seasons, topping 15%. Both the shotgun and under center rates rising largely came at the expense of pistol alignments, which weren’t ever a huge part of the offense in 2023 or 2024 but disappeared completely in 2025 until Lateef came into the lineup. The 16 pistol snaps on the year all came in the UCLA, Penn State, and Iowa games.
The other notable change here was that Nebraska used quads formations (with four non-backfield eligibles to one side of the formation) on nearly double the rate it did last year. But the quads rate was only still 4.8%.
Specialty Packages
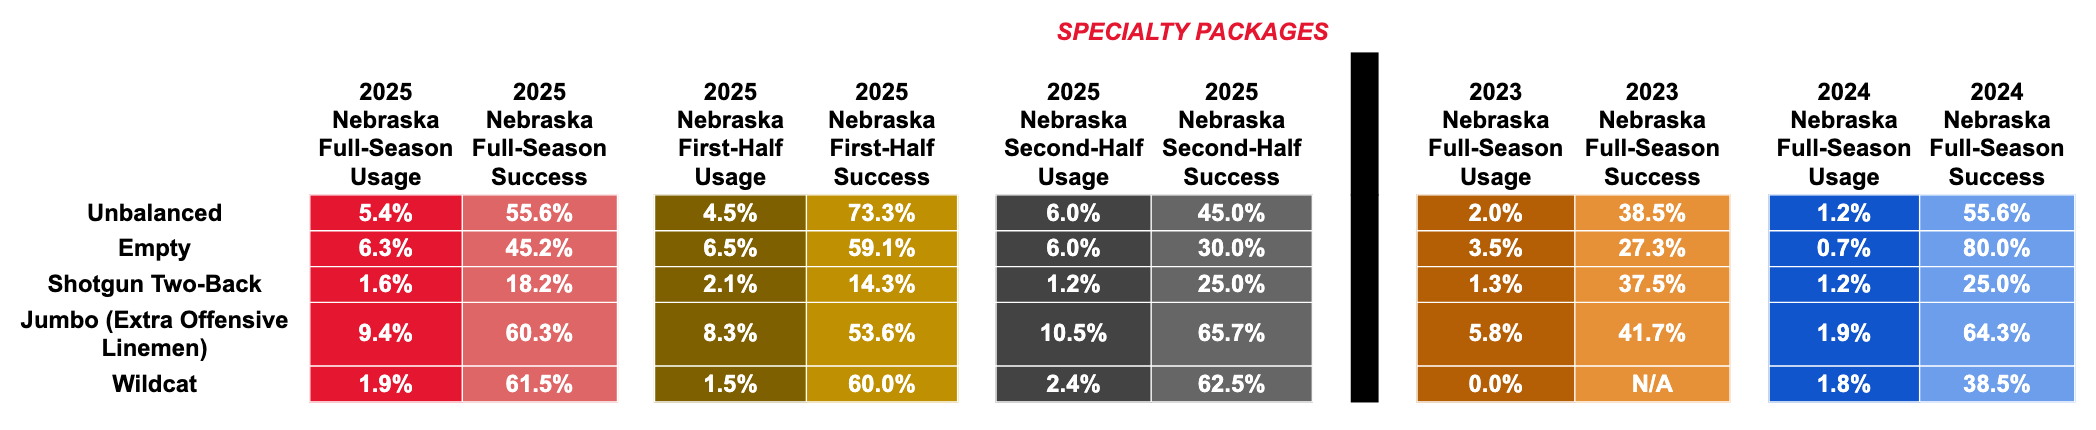
The two biggest changes to the offense we can see here are Nebraska more heavily utilizing Empty formations (alignments with none of the five eligibles in the backfield with the quarterback) and Jumbo packages, with at least one extra offensive lineman on the field.
The Empty change, I think, came from the improvement in Raiola’s quick-game operation: Empty alignments are frequent targets for defenses to blitz, usually with a guaranteed five-player protection (unless a tight end is attached to the formation), which is easy to manipulate. So you can only really put your QB in Empty if you trust them to diagnose pressure and throw hot to the spots where the blitz is coming from. Raiola was almost never put in Empty as a freshman, but that rate went up to 6.5% of the offense this year as he showed more aptitude at diagnosing what defenses were doing and throwing the ball quickly on fast-operation concepts. There’s more on that later.
Nebraska’s rate of using Jumbo quintupled in 2025 to almost 10% of all plays, predominantly when NU was under center but also sometimes when it operated in 12 personnel out of the shotgun. The Jumbo change, I think, was a bit more complicated and speaks to some broader changes across football but also individually to NU’s issues on the offensive line.
Jumbo — and, in general, heavier personnel and more tight end usage — has been probably the offensive schematic trend of the past couple seasons in high-major college football and the NFL; the Buffalo Bills popularized using Jumbo heavily last year, and it’s continued into this season, with many/most NFL and big college teams copying the extra-lineman strategy. The Los Angeles Rams have received a lot of attention in the last several weeks for making 13 personnel (with three tight ends on the field) their de facto base offense, and I saw most of the teams in last weekend’s opening round of the college football playoff operating at least some Jumbo personnel. More and more offenses across the sport are turning to Jumbo (and power-run football in general) as an answer to defenses that have gotten smaller and quicker to stop the spread. Football is cyclical; we saw spread out passing offenses take college football and the NFL by storm in the late 2010s, defenses adjusted to stop those, and now offenses are adjusting back by pounding the rock. We’re seeing it pretty much everywhere, and Nebraska participated in that. 3
But I also think the Jumbo rate was higher specifically in 2025 for Nebraska because Nebraska’s line needed the help of a sixth linemen pretty often to shore up its pass protection. NU ran the ball plenty out of Jumbo, but it also used the sixth lineman as a locked-in sixth blocker to throw deep-shot passes off play-action, as the tackles really struggled with any deep pass sets all year. So it was sport specific and team specific.
Bunches/Stacks and Condensed Looks
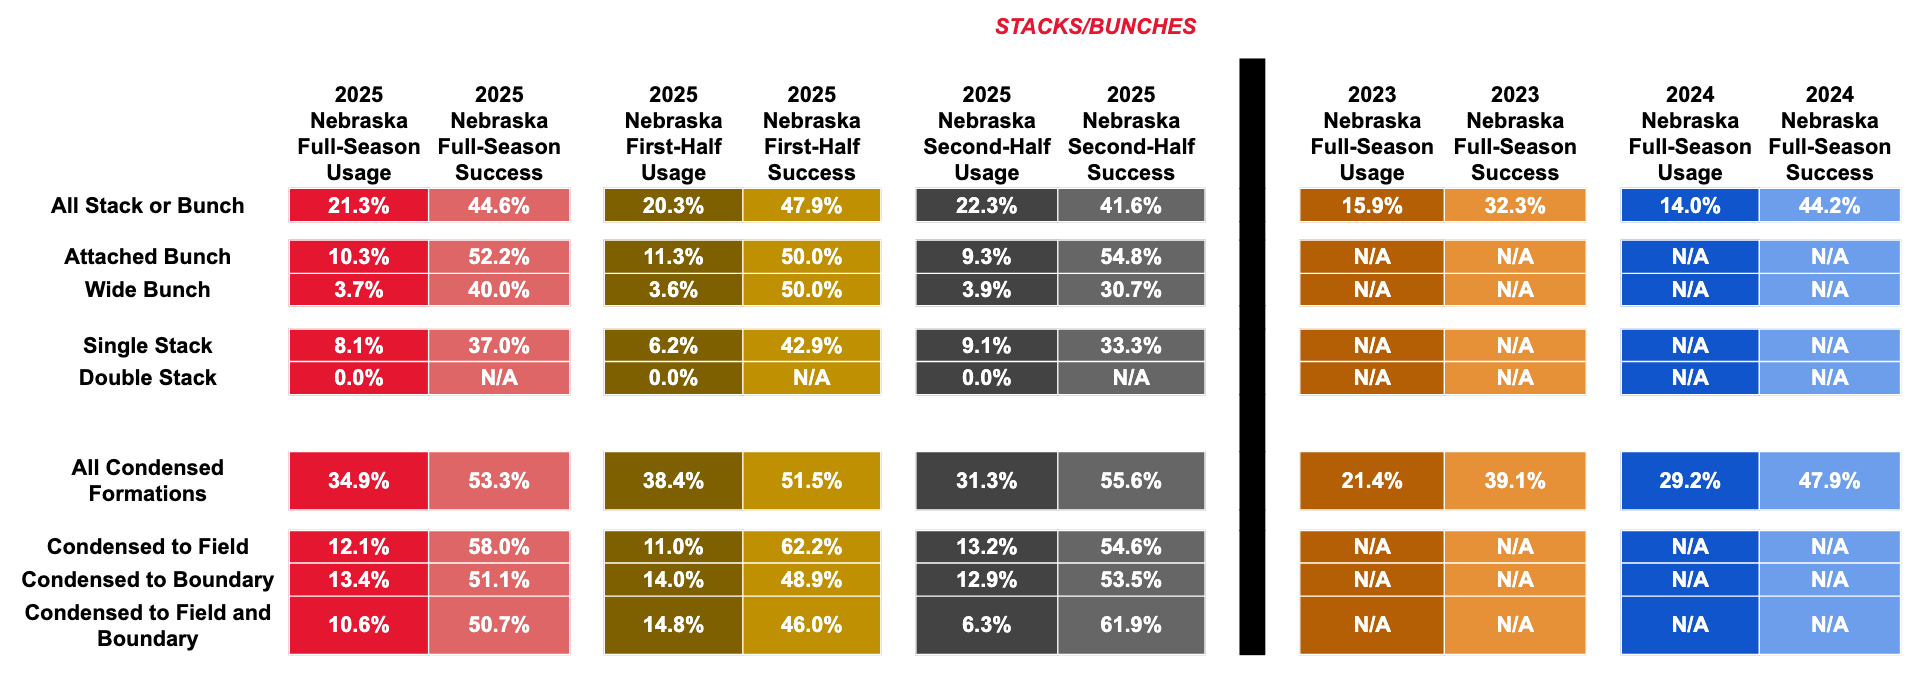
Holgorsen upped the rate of stack and bunch formations (used by offenses to get free releases off the line or generate traffic and misdirection on routes) by almost six percentage points this season; I kept more granularized data about the type of stack/bunches this season than I did in 2023 and 2024, so we can’t really compare the individual elements season-to-season. But the usage rates and success rates of the stacks and bunches stayed pretty consistent throughout the year.
The offensive alignment did get more condensed in 2025, with the rate of formations to feature at least one condensed side (with the eligible receivers in reduced distance from the offensive line than their normal splits) rising five percentage points from last season to 34.9% and almost 15 percentage points from 2023. The offense was especially condensed in the first six games of the season, at 38.4% of plays featuring at least one side of the field being condensed. Nebraska’s plays out of condensed looks had a 53% success rate, five percentage points higher than the overall offense’s success rate. Condensed looks were consistently more efficient than non-condensed looks all season. I think there’s an argument to be made that they should have been even more condensed.
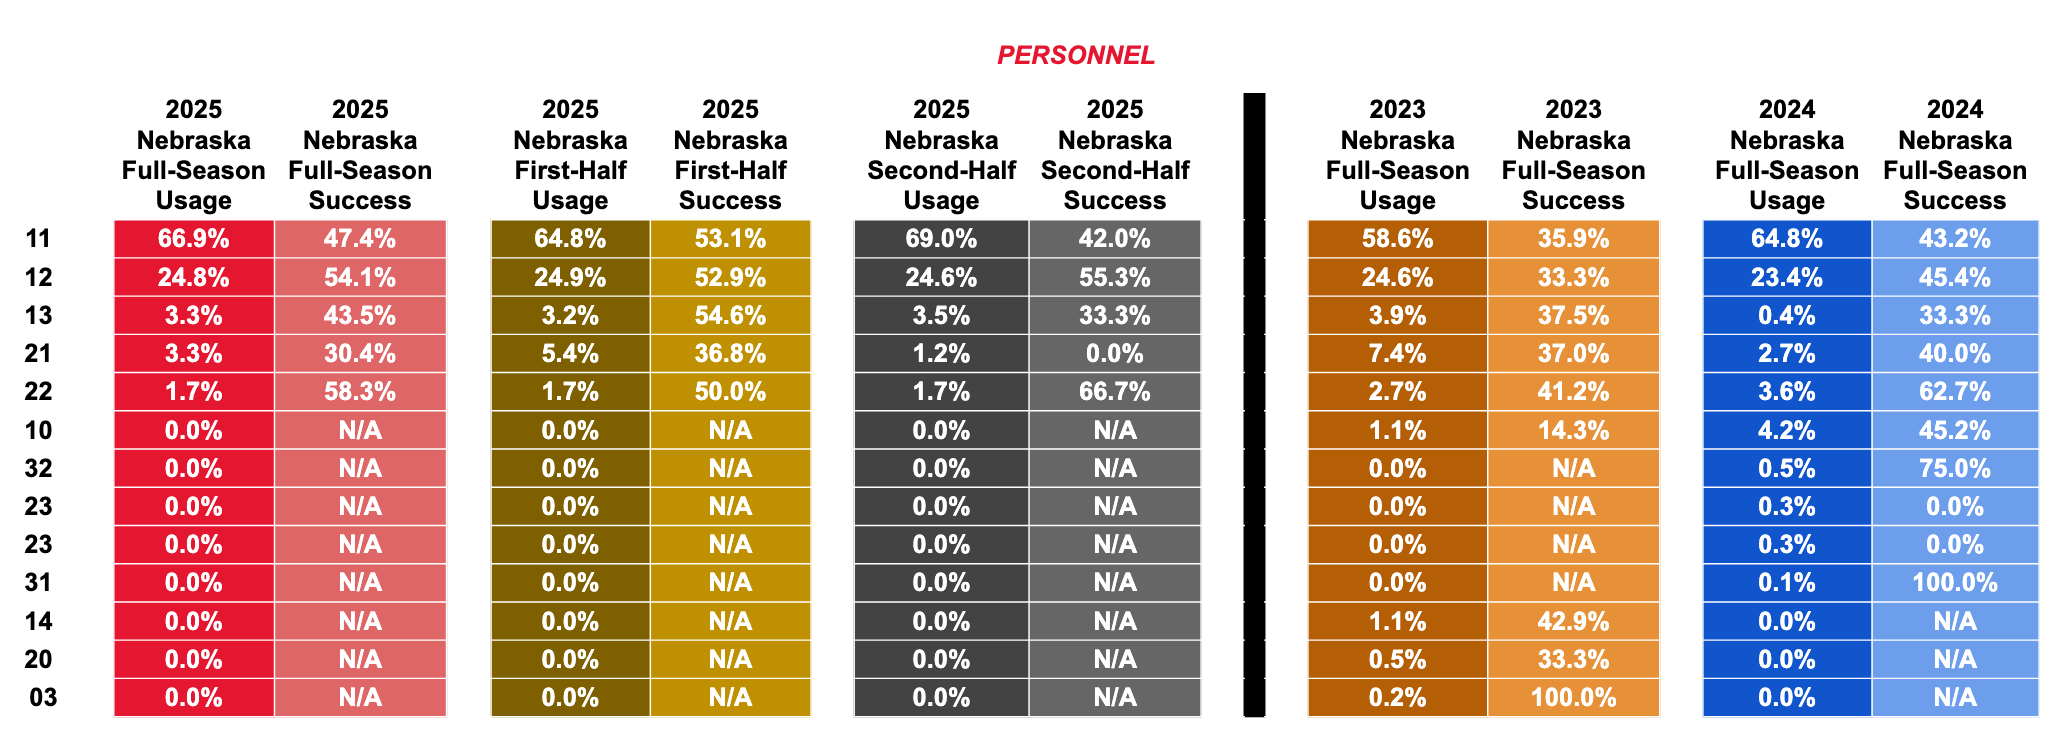
Personnel
We saw little in specialty personnel in Holgorsen’s first full year, in line with his promise to simplify and streamline the offense. NU used only five personnel groupings for the season, after using nine in 2023 and 10 in 2024. Nebraska also just spent more time in its top two groupings, with 91.7% of its snaps coming in 11 personnel (one back and one tight end) or 12 personnel (one back and two tight ends) this year. NU only spent 83.2% of its snaps in its top two groupings in 2023 and 88.2% in 2024. Another way to think about what we saw this year: Nebraska basically played with a tailback on the field with some four of Dane Key, Jacorey Barney Jr., Nyziah Hunter, Luke Lindenmeyer, and Heinrich Haarberg, and more or less only operated that way (outside of occasional subs at those spots).
Paring down can be good or bad: On the positive side, fewer personnels means you probably had more versatile individual players capable of filling more roles on the field (i.e., you don’t need to use four-receiver 10 personnel if your tight end is a receiving weapon). But that also means there was very little creativity in who was on the field or unique packages, which can be something you force a defense to spend time prepping for. Plusses and minuses, but we didn’t see a lot of unique groupings this season.
One other interesting thing in the personnel usage is that Nebraska’s rate of using two tight ends stayed static from Rhule’s first two years and that 12 personnel was Nebraska’s most efficient personnel. I’m not sure it was expected that an Air Raid maestro like Holgorsen would continue using tight ends to such a heavy rate, but he used the two-tight-end grouping more than either of Rhule’s previous seasons. I’m also not sure it was expected that Nebraska’s portal additions of two high-priced receivers would result in two holdover tight ends being its most effective grouping. There’s some noise in that 12 personnel success rate figure — multiple tight ends are more likely to be on the field in short yardage situations, which are easier to convert, whereas receivers are more likely to be deployed in more challenging long-yardage situations — but the discrepancy is pretty wide, and the 12 personnel performance is much better than it was in 2023 and 2024, so I think it’s a legitimate takeaway that the tight ends were very effective. That also speaks to how good Nebraska’s tight ends were: Lindenmeyer has always been a solid blocker but also became a receiving threat this year, and Haarberg also proved to be a really useful player when on the field, surprisingly as a blocker.
Tempo and Motion Rate
I questioned how much tempo Nebraska was going to use before the season. NU almost exclusively huddled in 2023 and 2024, with Rhule seemingly valuing protecting his defense over any of the offensive advantages generated by moving fast on offense at a higher rate. Holgorsen had employed tempo everywhere he’s been and was on record as saying he sees value in varying tempos between fast and slow during a game to keep defenses off balance. I wanted to see whose philosophy would come out on top.
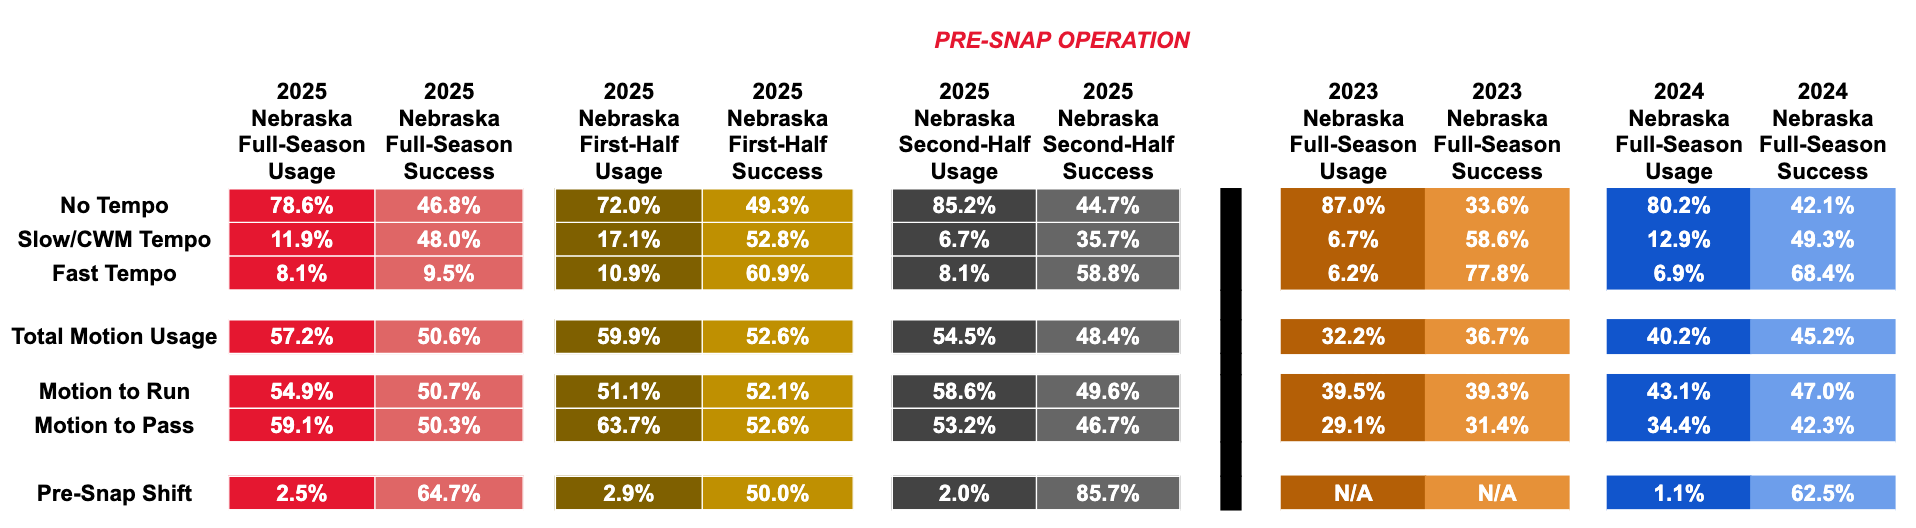
This one was fairly simple: Rhule won. NU did use tempo slightly more in Holgorsen’s first full season, but only by two percentage points, with 78.6% of Nebraska’s applicable plays coming out of a full huddle. I don’t have comparable data for other teams, but I’m educated guessing that would be in the bottom third of the nation in speed of operation. Nebraska moved slightly faster in the first six games of the year, but still huddled on 72% of its plays. The final six games — after it was fully understood the defense had some leaks and half of which was played with a true freshman starter at QB — the offense huddled on 85% of its plays. I think “no-huddle = better offense” can sort of be an overrated narrative, but I also think it’s clear NU needs to have at least more variety in how it operates moving forward if it ever wants to field a truly good offense; huddling almost 80% of the time is not putting defenses off balance at all.
One other huge schematic thing that went under the radar this season (partially my fault for not talking about it more) was Nebraska’s motion rate skyrocketing to 57.2% of plays featuring some motion, 12 percentage points higher than last year and almost double the 32% rate from 2023. Nebraska rarely utilized pre-snap shifts, but its 2.5% rate, combined with the motion rate, meant it was changing the picture for the defense pre-snap on 59.7% of its plays. Plays with motion vs. without motion had no significant difference in how efficient they were, but Holgorsen as OC undeniably took more pains to disguise formations, concepts, and tendencies than other offensive coordinators at Nebraska in recent years.
Motion Type
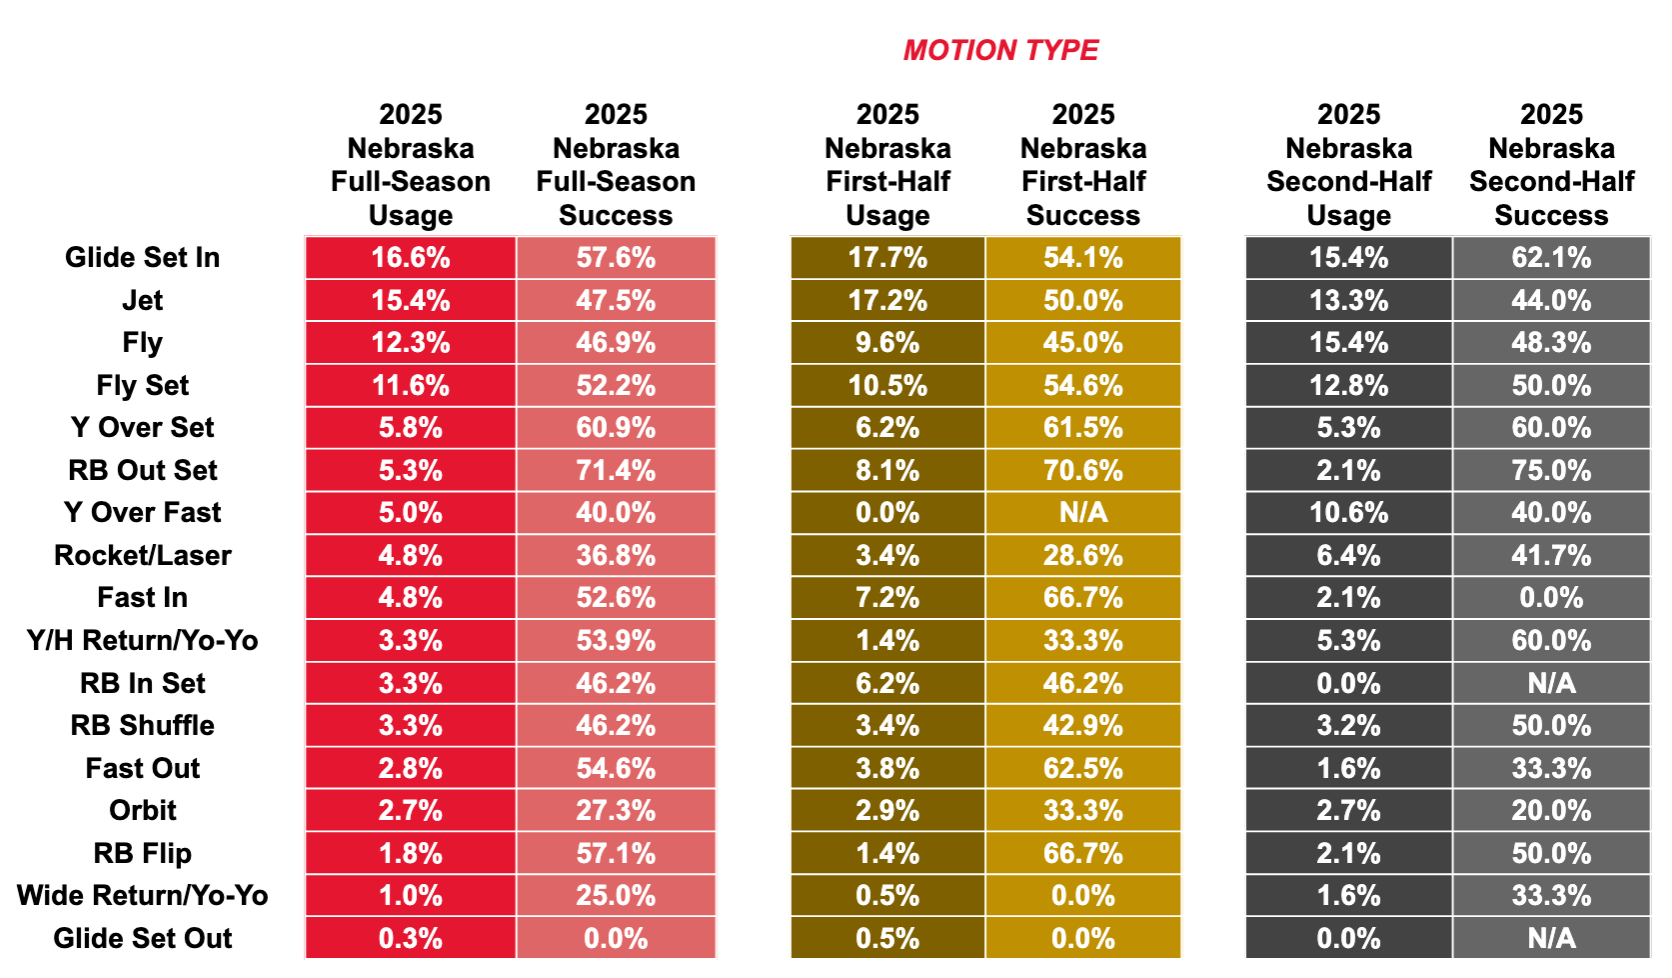
Previous coordinator Marcus Satterfield predominantly used motion as a threat to hand the ball off on a Jet Sweep or generate leverage on passing routes, but Holgorsen’s motion tendencies skewed far more toward pre-snap disguise and preventing defenses from communicating tendencies before the snap.
Holgorsen’s most used motions included:
Glide motions, when a split-out player motions toward or away from the center of the formation but doesn’t come in past the tackles;
Fly motions, when a split-out player motions across the center to the other side of the formation to change the doubles-trips-quads alignment;
Y Over motions, when an attached tight ends switches sides of the formation; and
RB In and Out motions, when the tailback either leaves the backfield to create an empty set or comes into the backfield from an empty set.
All are motions meant to change the picture on the defense right before the snap. When you consider that Nebraska’s most-used passing concepts all came out of very specific formational tells — Mesh Wheel, Spot/Double Slants, and the tunnel screen play all were predominantly run out of 2x2 formations, which is something every opposing DC would have known — you can understand why Holgorsen went to great lengths to prevent defenses from communicating those tendencies from the sideline by using so much disguising motion.
It’s also fairly notable that Nebraska still ran Jet motion as its second most used motion despite only utilizing Jet Sweeps as a play six times over the entire season. The threat proved effective, even without the actual play.
Motion Player
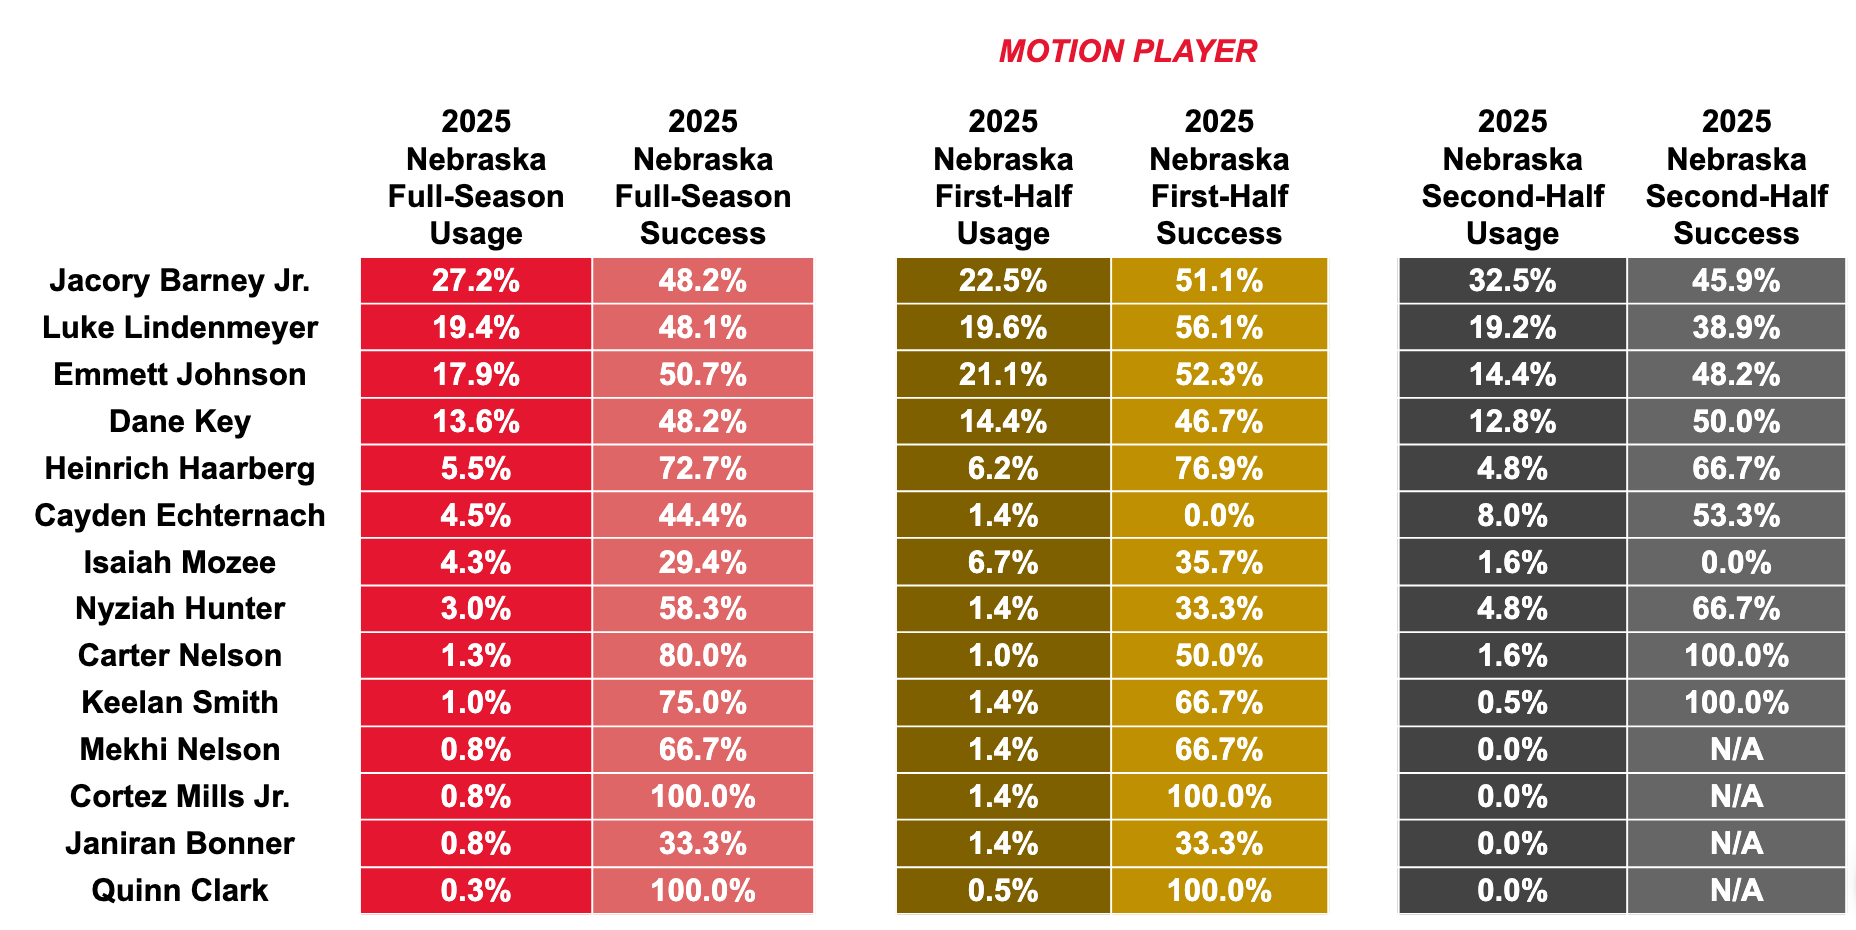
Barney was far and away the most motioned player, frequently used as the slot receiver to both serve as a threat on Jet motion and used to change the formation on Fly motion. Barney’s usage as the motion man went up in the back half of the year, to the point he was the motion man on almost a third of the plays featuring motion. Lindenmeyer also frequently was used to reset the strength of the formation before the snap or motion in from a wide split to serve as a blocker.
One notable thing from the first half to the second was the drop in how often Johnson was motioned. He was the motion player on almost 21% of NU’s motion snaps in the first six games, which fell to 14% in the back half of the year. That fell almost entirely because NU stopped motioning its backs in and out of the backfield from and to empty sets in the back half of the year. Also in the data is Cayden Echternach going from a 1.4% motion rate in the first half of the season to 8.0% in the back half as he got more involved as a blocking-only sub.
GENERAL PLAY DATA
Play-Type Distribution
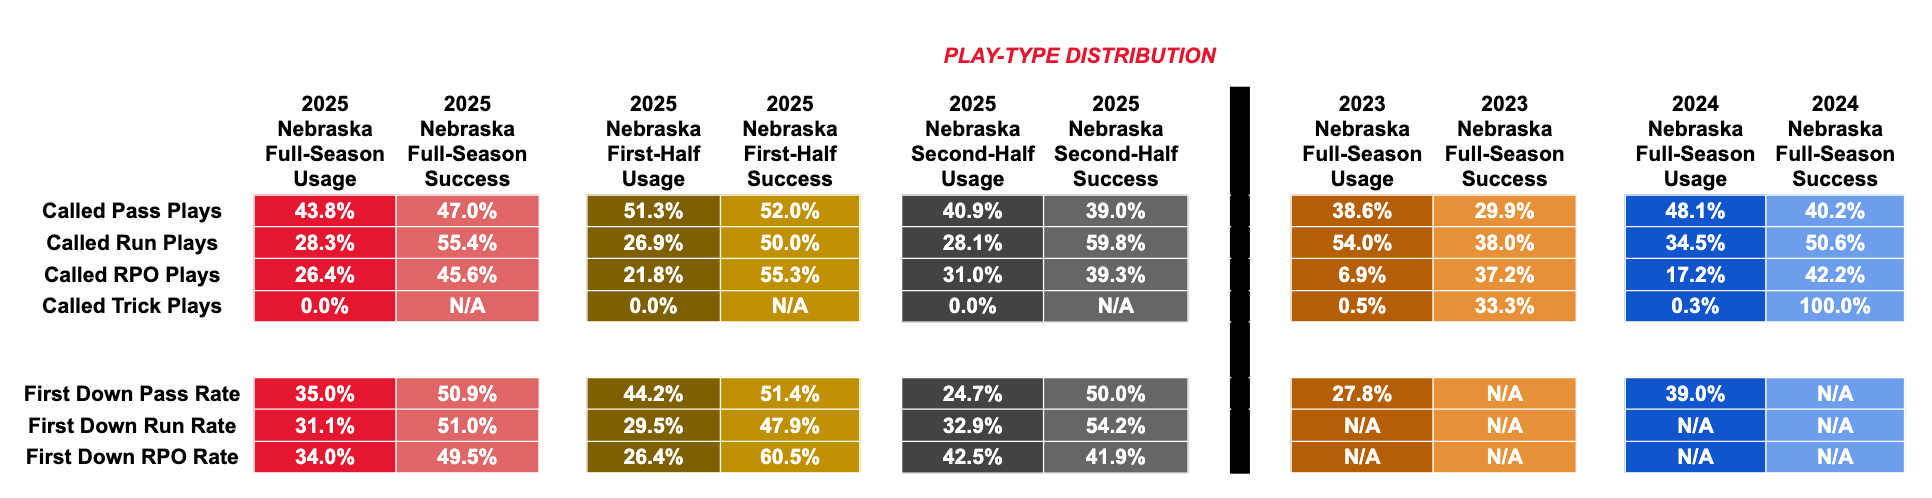
Nebraska’s improvement at, and eventual reliance on, run-pass option concepts (RPOs) was, I think, the most underdiscussed element of the season.
NU’s RPO rate in Rhule’s first season was at about 7% and about 17% in Year 2. Nebraska was also really poor at running them in both seasons, with just 37% and 42% success rates.
But NU was phenomenal at RPOs in the first six games of 2025. The rate of RPOs increased (to 21%) and the effectiveness skyrocketed, up to 55%. Putting the ball in Raiola’s hands in the spread shotgun and letting him decide where to attack the defense after the snap was far-and-away the offense’s best mode of moving the ball early in the year. NU also threw the ball on true passes at a higher rate and effectiveness in the first half than it had in the previous two seasons. There were real gains at quarterback distribution and decision making, at least according to the numbers.
After the midpoint of the season, though, Nebraska’s inability to pass protect at tackle led Nebraska’s staff to turn to RPOs (and quick-game passes) as the only ways to move the ball through the air. Johnson becoming the clear engine of the offense also had some role in that, but whatever the cause, the rate of true dropback passes fell from 51% of plays in the first six games to just 40% in the last six. I documented this several times in the game posts, but NU’s staff’s adjustment to the poor pass protection was to, essentially, just stop running real dropback passes, instead turning to throws off RPOs (where the line is blocking for a running play), and short, fast-release true pass concepts, where the line didn’t have to protect for long. Any deep-drop concepts, essentially, went out of the offense after the Minnesota game or were used once or twice a game. The downside was that with the ball not travelling far in the air, there were fewer chances for big downfield chunk passes, with any passing-game explosives coming off run-after-catch. Lateef — who was kept mostly to screens and rollouts in his first start vs. UCLA and given basic dropback concepts vs. PSU and Iowa that he didn’t execute well — entering the game further throttled the frequency and effectiveness of the true passing game.
The other standout in the play-selection splits is how efficient Nebraska’s true running game was this season, especially in the second half of the year after Johnson started really going off. NU’s success on true run plays was 55.4% on the season, five percentage points higher than last year and 17 percentage points higher than in 2023. It’s considered good to be anywhere near 50%. The success rate on true runs in the final six games was an even more blistering 59.8%, a credit to just how much Johnson was cooking in the back half of the year.
It should also be noted that NU did not run a single trick play — not one — on the year.
Formational Play-Type Distribution
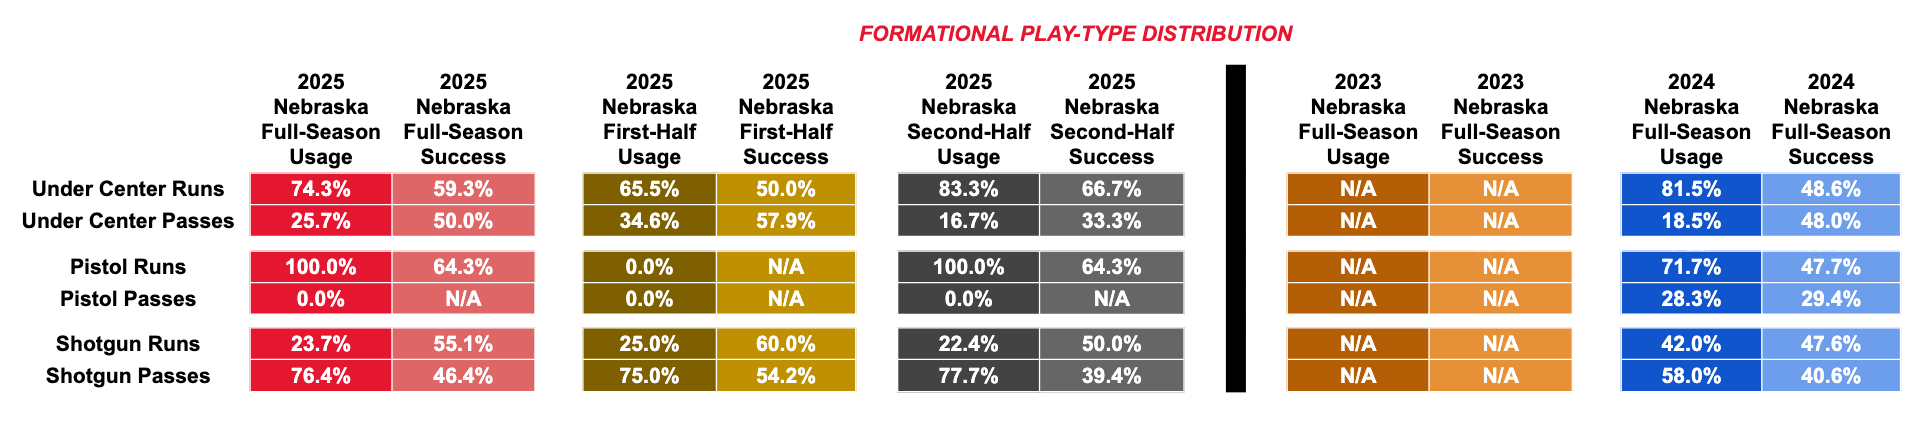
Nebraska held a fairly sizable pass-first tendency when in the shotgun and a fairly run-heavy tendency when not, with 74% of the plays under center and all of the plays out of the pistol being runs, with 76% of the plays out of the shotgun being true passes. That was probably a pretty big indicator for defenses.
The efficiency is more interesting. Nebraska’s passes from under center were very effective in the first six games, with a 57.9% success rate. Considering most of the under-center passes were deep-shot style plays that are hard to complete, hitting on those at an almost 60% success rate is excellent efficiency. But in the second half of the year, the success rate on under-center passes fell to 33.3%, an almost 30-percentage point drop in efficiency. Nebraska didn’t pass much under center in 2025, but the success of them fell off in Big Ten play and after Lateef entered in a major way.
Also worth noting is how dominant the under-center running game became in the back half of the season, with a completely insane 66.7% success rate on under center runs in the final six games. That, too, was a big part of why Holgorsen got under center and put multiple tight ends on the field more: It was far and away the best thing Nebraska’s offense did. Being that efficient on just straightforward run concepts against Big Ten defenses is something I have never seen in my five seasons of doing this newsletter. If spreading the formation out to let Raiola make a decision was Nebraska’s best offense in the first six games, then getting in heavy personnel under center, wadding up the line, and handing it to Johnson became their most efficient play in the final six games.
Opponent Box Data
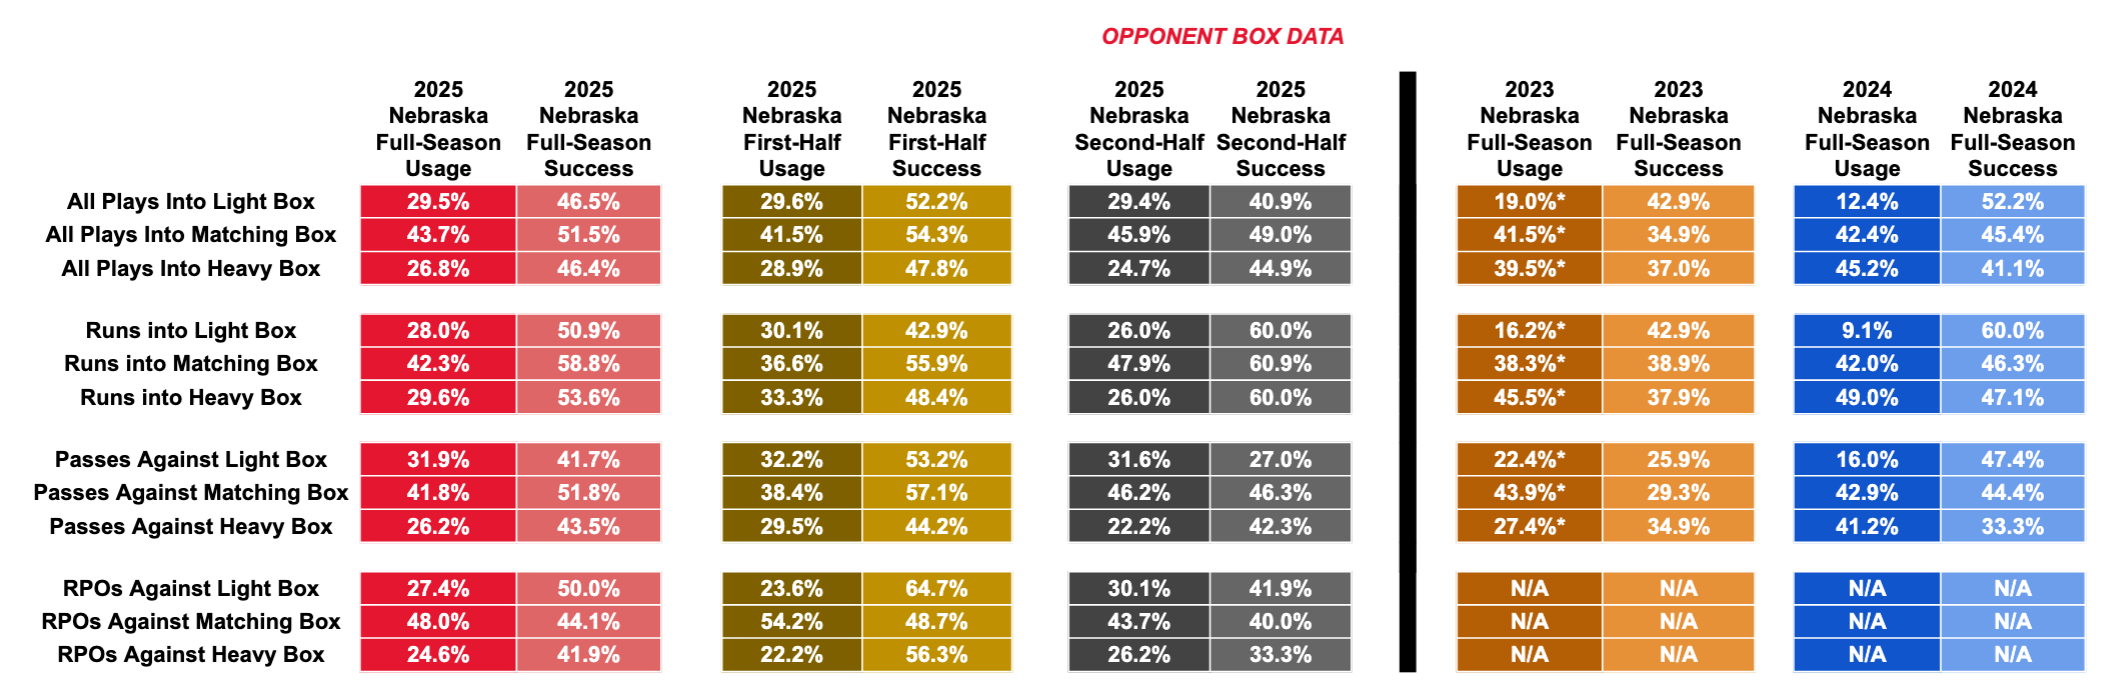
Most power-conference teams had little fear of stacking the box against the 2023 and 2024 offenses, knowing those passing attacks offered little threat to beating them. The rates of defenses deploying “heavy” boxes — meaning more defenders between the surface of the formation to 5 yards depth than the offense had blockers — was at 39.5% of plays in 2023 and 45.2% in 2024.
But one thing Holgorsen — and the passing game’s improvement — did fix this year was preventing teams from being able to play in heavy boxes so frequently. The rate of plays defenses spent in heavy boxes fell drastically, by nearly 20 percentage points to 26.8%, as Nebraska’s more competent passing and RPO performance was more frequently able to punish defenses that chose to play with stacked lines. Nebraska’s plays on the season into a light or matching box — where it would have either a draw or advantage in numbers for running the ball — was just below 75% of snaps; in the previous two seasons, that rate had been at about 60% and 55% of plays. The boxes lightened a lot this year.
One other telling piece of data here is in the performance of the passing game against light and matching boxes. Light or matching boxes would be situations advantageous for the defense to stop the pass. Nebraska was very good at throwing the ball into those light boxes in the first six games — with a 53% and 57% success rate on true passes against light and matching boxes — but that success fell off heavily in the final six games, with the offense fielding just a 27% success rate on true passes against light boxes. Both quarterbacks struggled in those situations in the back half of the season, with Raiola having a 25% success rate against Minnesota and a 27% success rate against Northwestern.
The success of Nebraska’s running plays against heavy boxes is also another opportunity to show how good Johnson was this year: Even when teams geared up to stop him by putting extra defenders in the box, Nebraska had a 53.6% success rate on true runs, and it was at 60.0% in the second half of the season. That’s absolutely nuts.
RUN GAME
Optionality Data
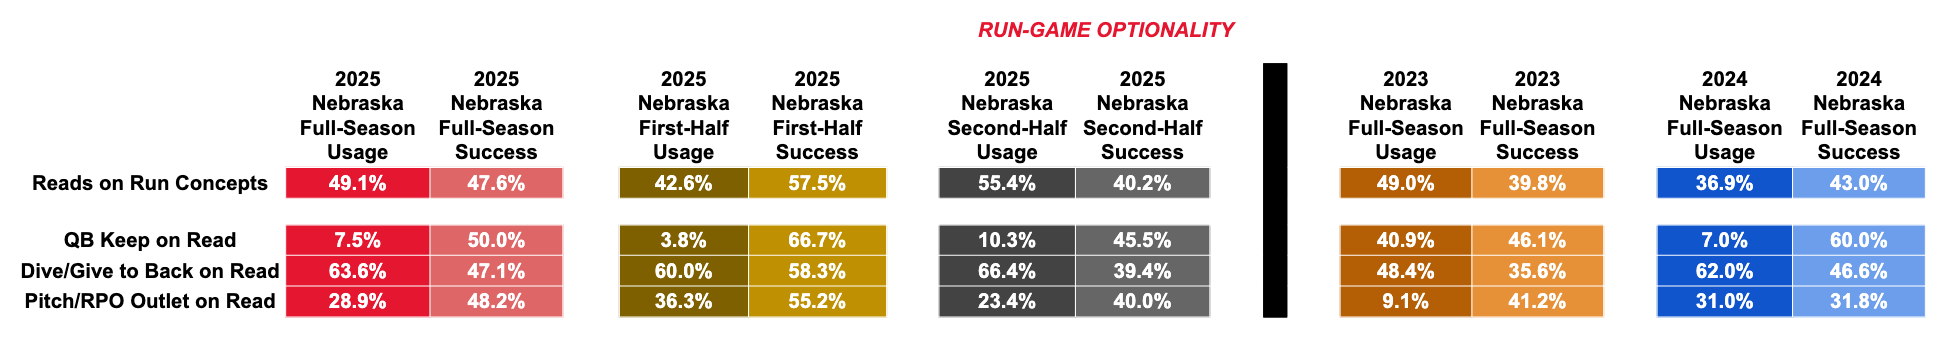
Despite all the recent handwringing after his transfer about how Raiola’s inability to run hurt the offense overall and how Nebraska can’t function without a mobile quarterback, it should be noted that the team’s optionality package operated much, much more efficiently in 2025 with Raiola than it has in recent years.
Nebraska approached optionality with Raiola through throws off RPOs rather than keepers by the QB to run, but the effect is the same: keeping the defense honest and punishing post-snap selling out on the run.
And those plays featuring reads by Raiola were some of Nebraska’s best concepts all year long and much improved from any point in Rhule’s tenure: NU’s run concepts with a read were four percentage points better this year than last season and eight percentage points better than 2023, when NU played most of the season with runners behind center. The efficiency on read plays was 17 percentage points better by success rate in the first six games (all Raiola starts) than it was in the second half of the year (three of which were Lateef starts). Option plays in Lateef’s three starts had just a 40.2% success rate, while option plays in Raiola’s starts had a 48.7% success rate. I’d be very careful if you’re one of the people saying that a lack of a mobile quarterback hurt the team or that getting one will be an upgrade over what NU operated with for most of last year: The data would strongly disagree with you. Nebraska operated the best it ever has on option concepts under Rhule this past season with Raiola as the operator. I think it’s going to be difficult to find an upgrade over that in the portal or from Lateef.
The biggest discrepancy in the option success between the two QBs was how often they threw the ball off the RPOs to actually punish the defense: Lafeef threw the ball on an RPO just six times in 39 opportunities, instead handing off to the back on 69% of his RPO snaps. The success of the handoffs off the RPOs fell to just 37% with Lateef in the game, presumably because he was handing it off on plays that should have been throws, meaning the runs were happening into non-advantageous boxes. Raiola was much more frequently throwing the passes off the RPOs (32% of his RPOs), which made the runs much better by success rate (50%) because the runs were happening into advantageous boxes.
RPO Type and Efficiency
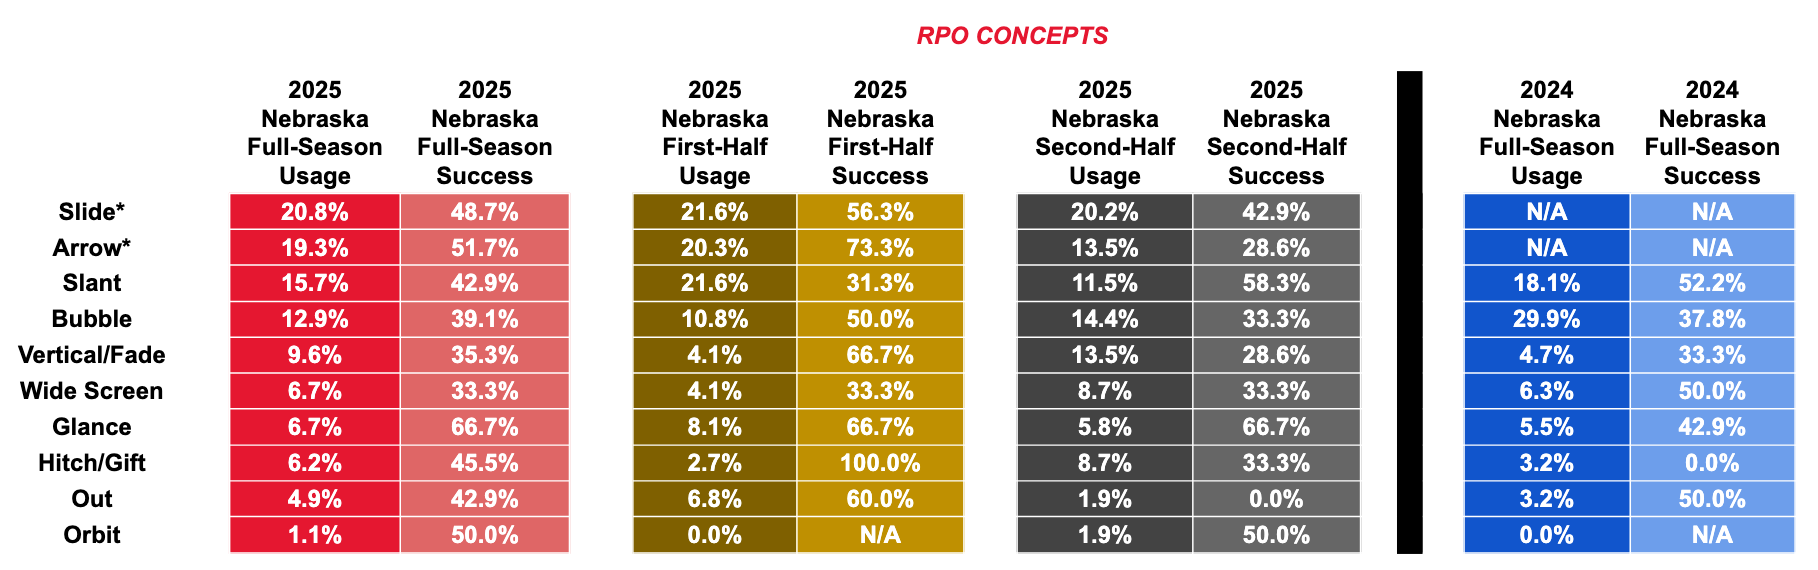
NU broadened its RPO menu pretty significantly in 2025. Eight RPO types registered more than 6% of Nebraska’s RPO reps, with just four doing the same in 2024.4
Slide RPOs — where a player crosses the quarterback’s face toward an edge defender being read before leaking into the flat, usually a tight end — were the most used RPO type, generating some pretty big plays to Lindenmeyer in the flat or throws behind the slide route to the hitch. Raiola was really good at operating those and whipping the ball to the right guy, especially the sit route behind it, which went for big completions against Michigan, Maryland, and Minnesota. Arrow RPOs — with a player running horizontally toward the sideline — also constituted 19% of the RPOs. In 2024, I logged those two RPO types together (for reasons I’m unclear about), and they were at 29% of the RPO usage. This season, they were at 39% combined.
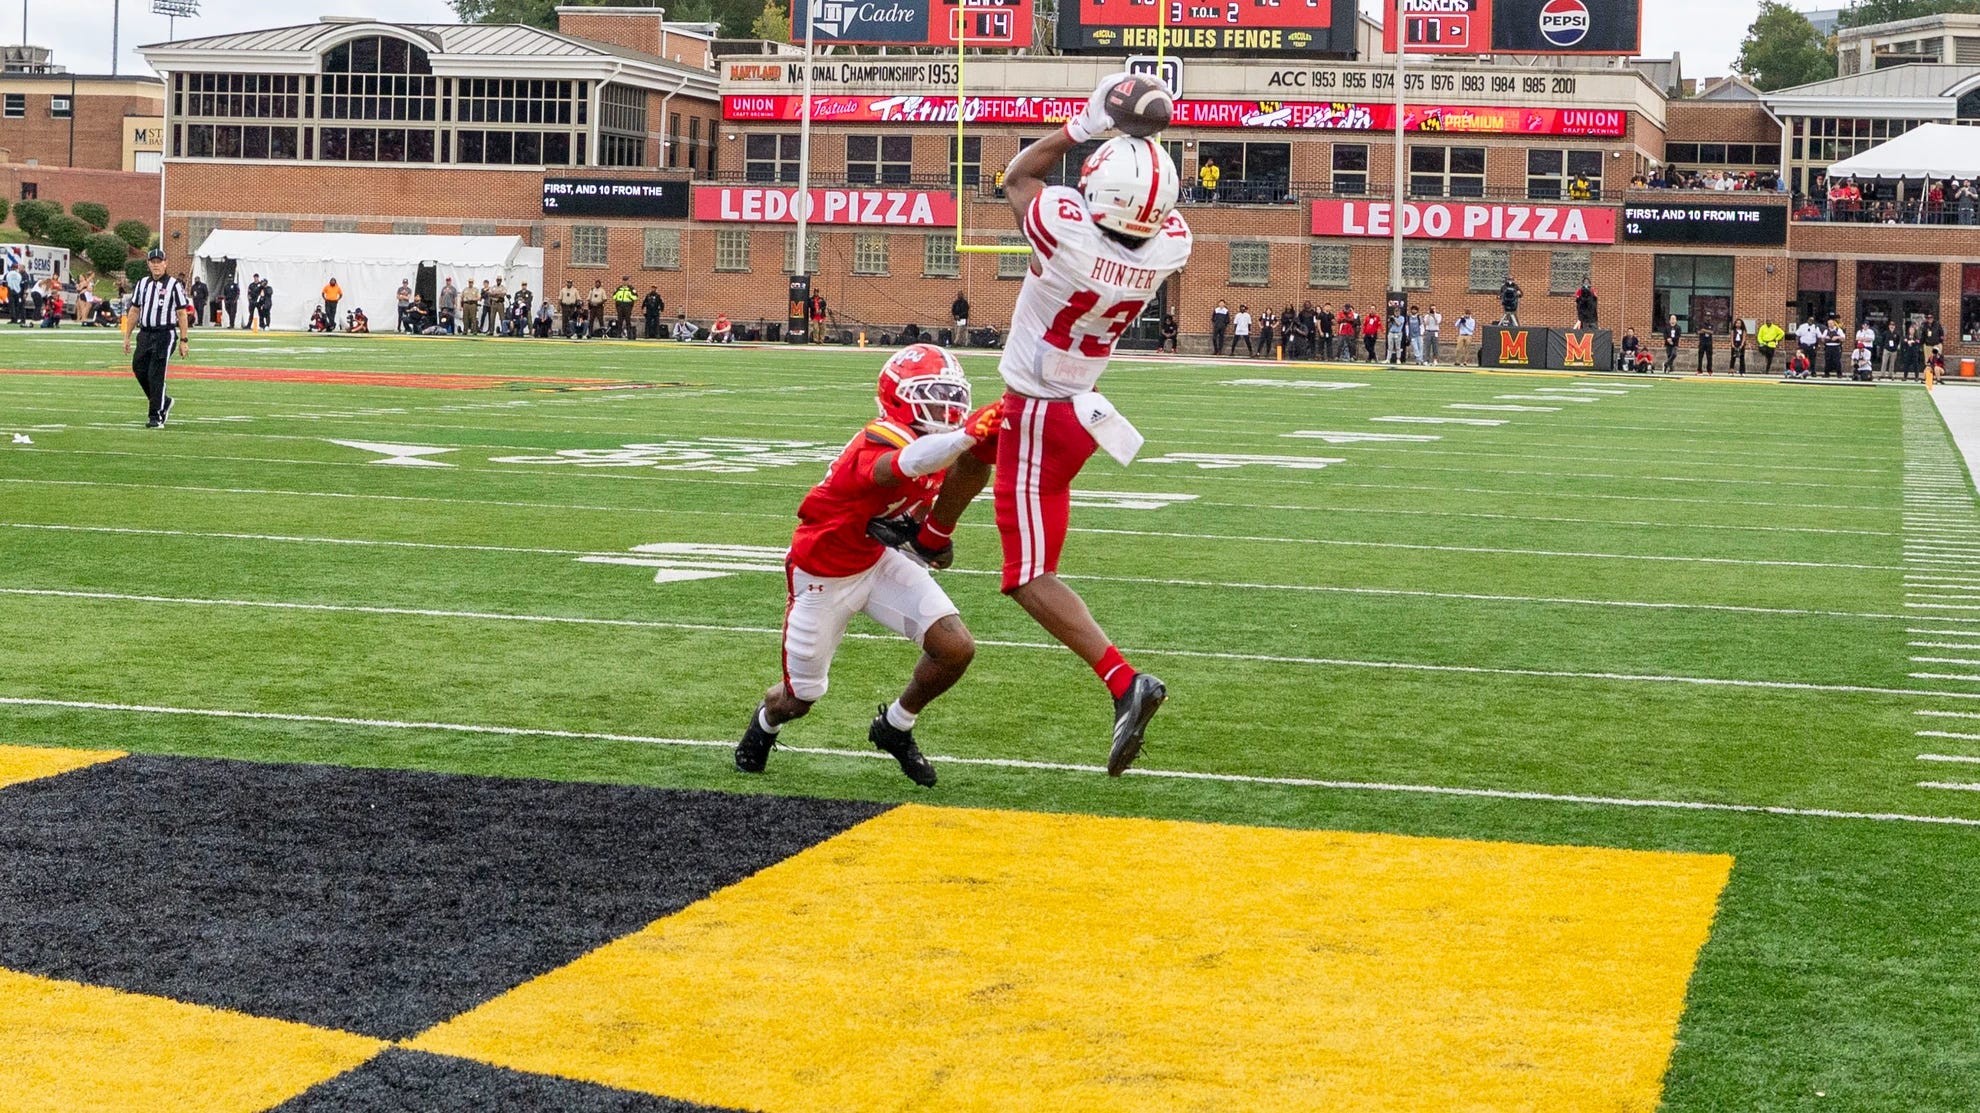
NU also upped its usage of Slant and Vertical/Fade RPOs. from past seasons. The Vertical/Fade RPOs also delivered some of the season’s biggest plays, including the deep ball to Hunter in the Cincinnati game and all of his catches on fade balls at the goalline. All of the fade throws this year came off RPOs, meaning Raiola was pulling the ball from run calls to throw those fades.
Run Concepts
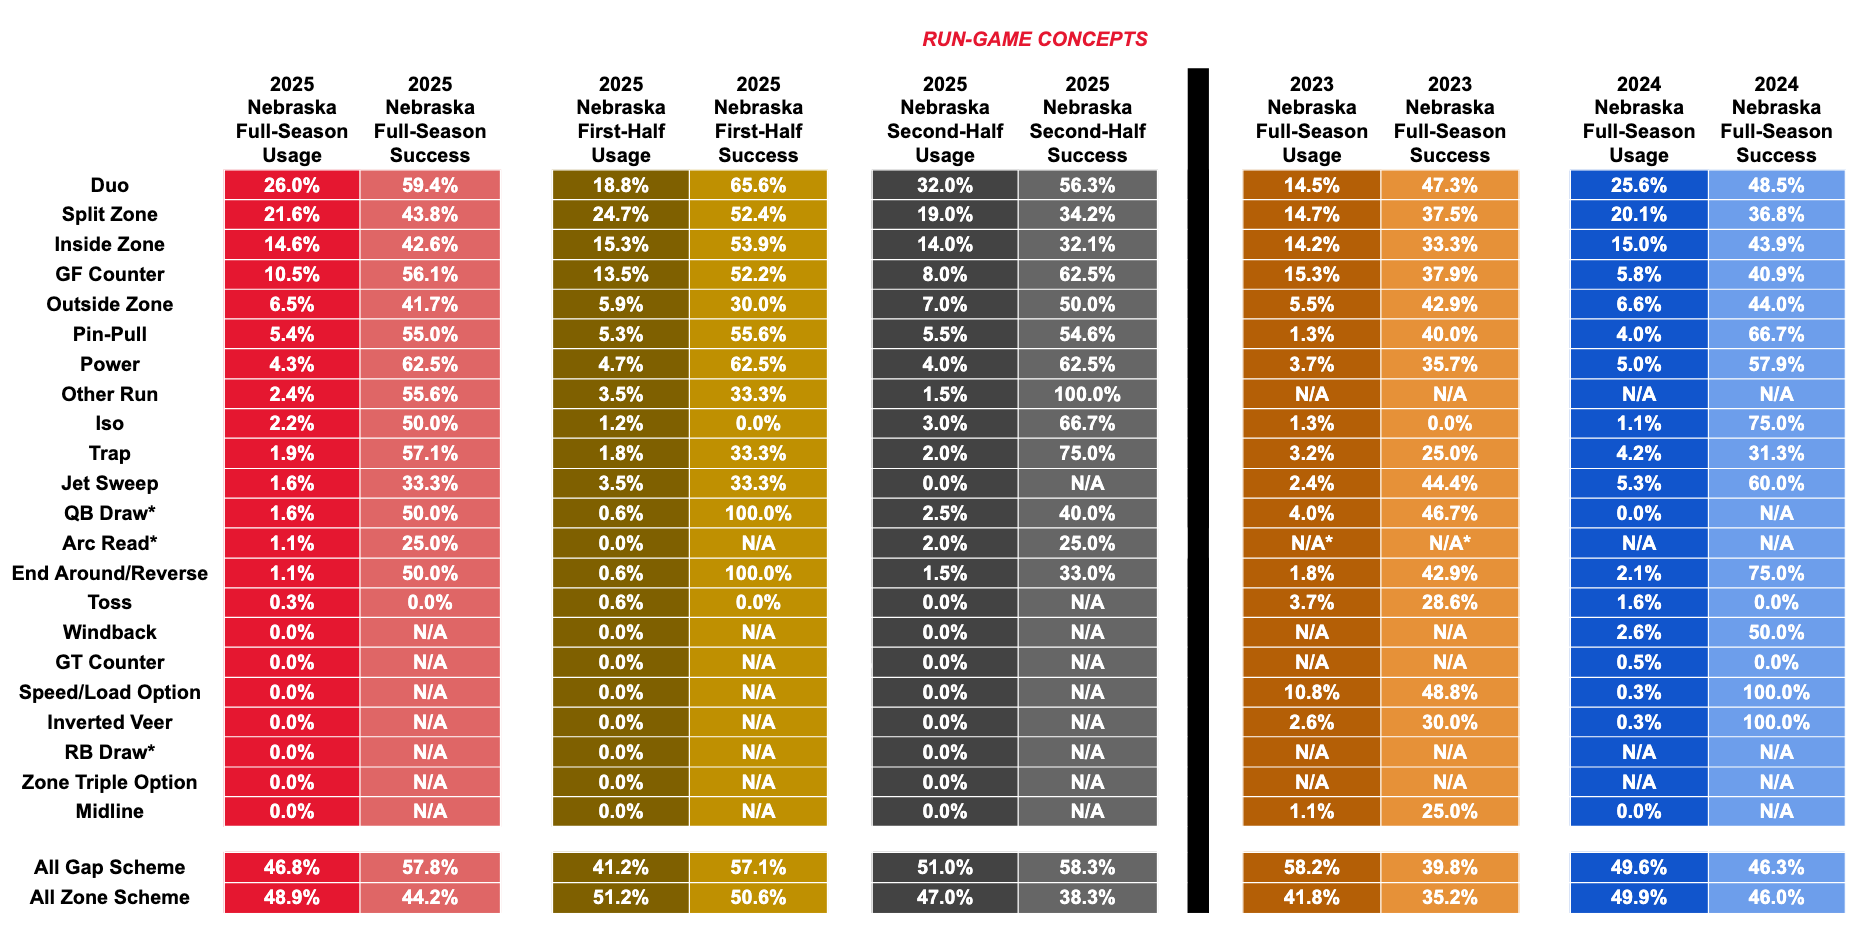
Nebraska’s run game can be bifurcated pretty easily this year: In the first six games, Nebraska was primarily a Split Zone team, trying to hit cutbacks off zone action with Johnson. But in the second half of the season — specifically after the Minnesota game — the offense gravitated far more to Duo, an inside gap-scheme run with two interior double teams. NU ran both concepts all year, but Split Zone was at 24.7% usage in the first half of the year but fell to 19% in the second, and Duo was at 18% usage in the first six games before flipping to 32% in the second half of the season. The usage of the two runs essentially swapped in the second half of the season.
The change, I think, largely happened because the staff zeroed in on two things: How much the tackles struggled moving in space and on how adept Johnson was at navigating backfield traffic and finding the holes on the interior.
Zone runs require all five linemen to largely be moving fluidly together while staying engaged on their defenders as they move and execute the play. Most of Nebraska’s tackles this year struggled operating or staying engaged in space, which was leading to a lot of busts toward the edges on zone concepts. Zone runs also require a back to make one decisive, explosive cut upfield into one of many gaps. But Duo blocking does not really require the tackles to move laterally while engaged, instead asking the backside tackle to wall off the edge player from getting penetration, making it look, at times, more like a hinge block with the function of the tackle pushing the edge upfield vertically. The playside tackle is downblocking straight ahead, often in a combo with a tight end and climbing vertically, something specifically Turner Corcoran and Elijah Pritchett were much better at than engaged movement in space. Watch Pritchett here for an example of the hinge block:
Running more Duo essentially meant eliminating the tackles — and the defenders they were blocking — from the play: The backside tackle hinging to wall-off the play and allowing themselves to be beat upfield, if necessary, and the playside tackle just driving straight ahead, frequently on a double and climb.
Switching to Duo not only proved better for the tackles but also played to Johnson’s strengths. Johnson was capable of finding seams on zone runs, but he was also not a particularly explosive athlete capable of hitting the accelerator against power-conference defenses, and he also semi-frequently missed the open zone holes and was not the most disciplined “let’s take this 3 yards in front of me” type of runner. But he was great at making people miss in a phone booth, so switching to Duo from Split Zone as the primary run took less off his pure upfield burst and zone vision and essentially turned every run into a straight-ahead phone booth situation where he could go right into making people miss right away, which proved more effective if the the interior blocking failed. A not-insignificant chunk of the Duo plays looked like blocking messes, with the tackles isolated, an interior block failing, and Johnson sort of picking his way through the deconstructed mess.
The switch was effective: Nebraska’s Split Zone reps on the season had a 43.8% success rate on the year, while Duo finished at 59.4%.
Also notable in the run game data is the increase in effectiveness of Counter in the back half of the season. NU’s GF Counter reps in the second half of the season had a 62.5% success rate, with the looks most frequently coming off a play with Lindenmeyer and Echternacht as the pullers. NU did run Counter five percentage points less than it did in the first half of the season, but it worked better.
The one other big change to note is the disappearance of Jet Sweeps from the offense. Those Jet Sweeps constituted 5.3% of the running game last year, but fell to 1.6% this year; NU ran just six reps of Jet Sweep on the season, and none after the Houston Christian game. Holgorsen is the coach who brought the touch-pass variation of the Jet Sweep up to the major conferences, so for him to not use it at all in conference play was a bit surprising.
PASS GAME
Pass Type
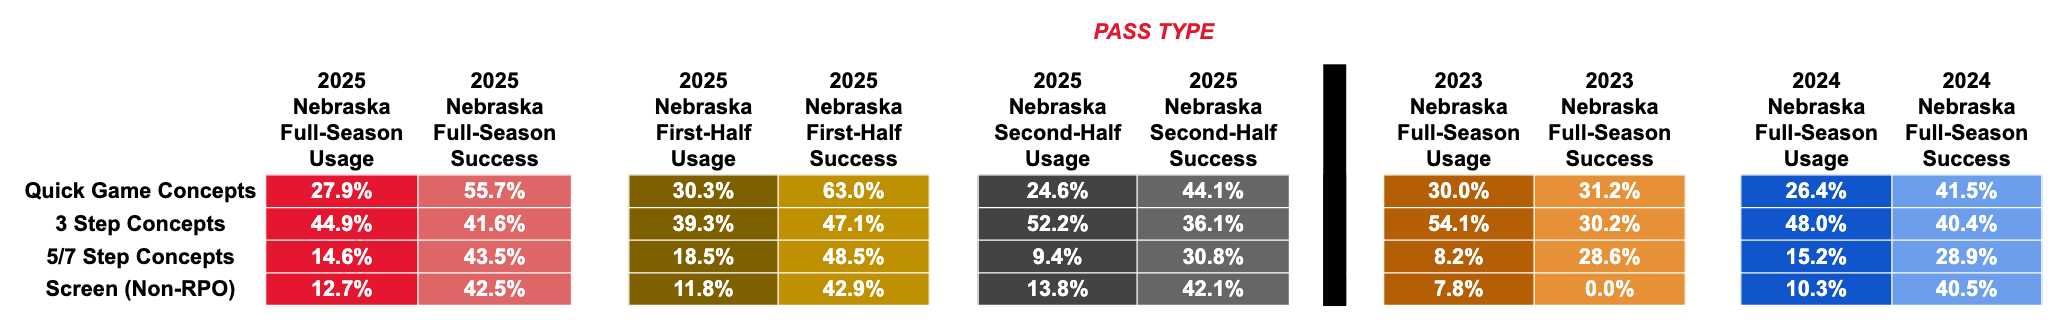
Overall, NU’s distribution of passes didn’t end up looking that different from past years, but there are some interesting elements here.
First is that Nebraska made pretty incredible improvements in the effectiveness of its quick-game passing last season. Quick-game concepts are passes with shorter routes that require fast, blink-and-throw processing and decisions by the quarterback. NU was atrocious at those passes in 2023 and improved in 2024 to a still-poor 41.5% success rate, but Raiola made a huge jump on operating those style plays in 2025, with the success rate on quick-game throws rising over 20 percentage points to a great 63.0% in the first six games of the season. The classic “Air Raid” offense is mostly constituted of these concepts, so it makes sense that Holgorsen would boost Nebraska’s performance on these style of plays. But it’s still worth praising how much improvement happened there.
The success of the quick-game throws fell off in the second half of the season, but that was mostly on Lateef: The success rate of quick-game passes was at 61.9% through the USC game but fell to 29.4% against UCLA, Penn State, and Iowa. Nebraska lost a lot of its ability to operate in the quick game from the quarterback position when Raiola went down.
Raiola did struggle more in the second half of the season on deeper throws, with the fall in success rate on three-step and five- and seven-step concepts fairly attributable to him.
You can also see the inability of Nebraska’s tackles to pass protect on deeper drops shows up in these numbers. NU tried to attack deep with five- and seven-step drop concepts on over 18% of its plays in the first half of the year, but that number was halved in the final six games to 9% after it became apparent the tackles were a liability on any sort of deep set against Minnesota.
Situational Passing Performance

A few fairly notable changes stand out here:
One is the passing game’s improved performance against the blitz, largely due to Raiola’s growth as a processor and diagnoser on the quick-game passing. NU’s true dropback passes against blitzes and pressures in 2024 had just a 38% success rate, and Raiola had very poor games against sim- and creeper-pressure-heavy gameplans by Indiana and UCLA. Cincinnati tried the same thing on him in the opener and it didn’t work; from the start of the season he eliminated disguise blitzing from being a weakness opposing defenses could hammer him with, to the point that his dropbacks against blitzes and pressures were more efficient by success rate than his dropbacks against non-blitzes and pressures. That was a pretty huge development.
Second was the struggles against the two-high safety and man coverage splits.
Nebraska’s true dropbacks against coverages where the middle of the field was “open” — coverages that come out of two-high-safety shells, like Cover 2 and Cover 4 — had a 38% success rate, while dropbacks against coverages where the middle of the field was “closed” — coverages that come out of single-high-safety shells, like Cover 3 and Cover 1 — were at a 55.8% success rate on the season. That is a bit to be expected, as two-high shells are generally better defenses against the pass and single-high shells are meant to stop the run, but the disparity was pretty stark this year. Lateef especially struggled against the two-high looks, with just a 30.4% success rate on his 46 true passes against two-high shells.
NU’s true dropback passes were also significantly worse against man coverage than zone coverage, with the zone success rate at 48% and the man success rate at 38%. Raiola’s isolated splits were even more stark against man coverage, with just a 34% success rate against man but with the zone success rate rising to 52%. Lateef’s success rate against man coverage was at 51%, but most of the success came against 19 man reps vs. the bad UCLA defense; Lateef’s success rate on throws against man coverage were at 38% vs. Penn State and 18% against Iowa. Winning against man coverage is as much on the receivers as it is the quarterback — getting open against man coverage essentially comes down to “Did you beat the guy covering you?” — and Nebraska’s (improved) receiver corps did show its limitations there.
Play-Action Passing
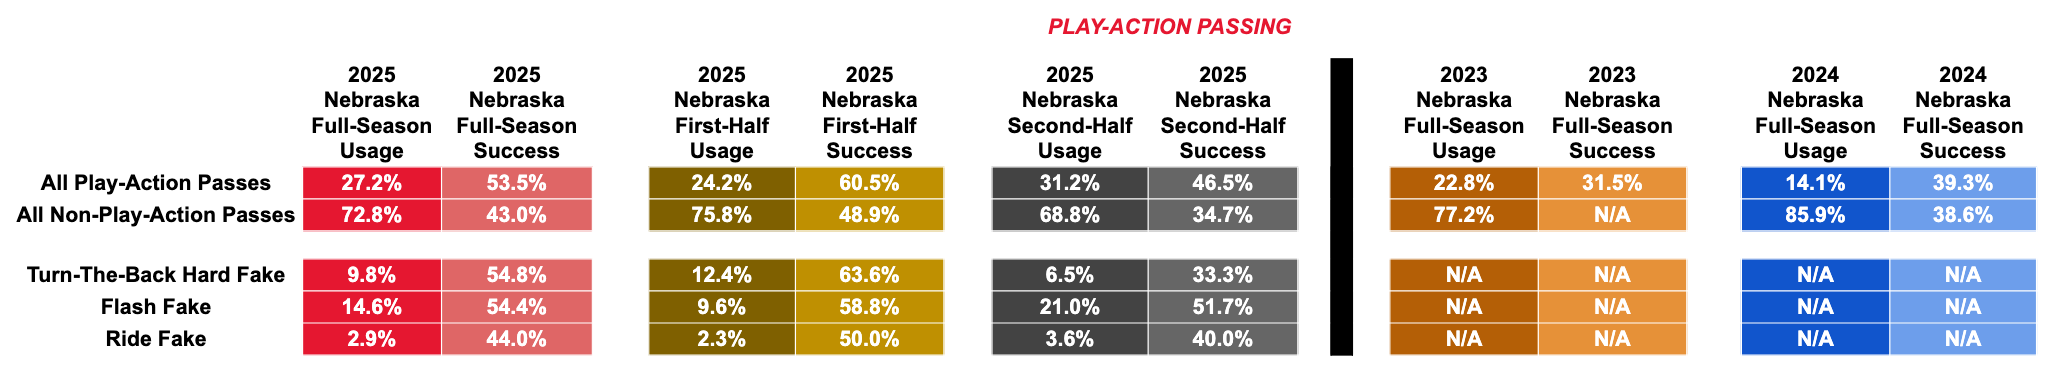
Nebraska’s passes off play action were better than their standard throws all year, with the overall split 10 percentage points better for the season and both the first- and second-half splits also at least 10 percentage points better.
Turn-the-back fakes from under center were especially effective in the first half of the season and were NU’s most used play-action type, constituting 12.4% of the passing game. Those play-action fakes from under center had a great 63.6% success rate in the first half of the year, but both the frequency and effectiveness fell off in the final six games: Nebraska used under-center fakes on just 6 percent of its passes, and those plays were successful a third of the time. That’s a bit curious, as the under-center run game took off in the back half of the year. The play-action fakes should have theoretically been more effective in the second half of the season as the under-center run game became more of a threat for defenses, but we saw the opposite happen. I think that’s something you could criticize the staff for not turning to more frequently — or getting more creative with — over the final six games.
In place of under-center fakes, we saw Nebraska trying to run more play-action fakes from the shotgun in the back half of the season. That rate was higher for both Raiola and Lateef. Again, that feels like the run game not being tied to the play-action game — Nebraska made the under-center run game more a part of its offense in the final six games but turned to running play-action more from the shotgun. A bit curious why that change occurred.
I didn’t keep specific data on the types of play-action fake used in past seasons, so that data is N/A’d out in the 2023 and 2024 sections.
Pass-Play Movement
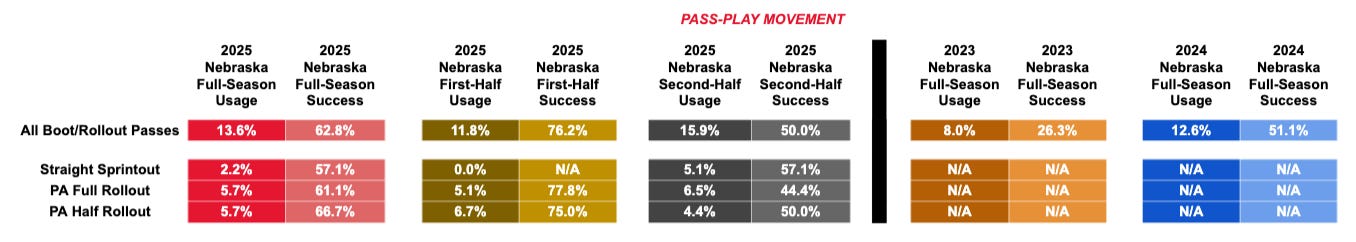
Nebraska’s usage of designed roll-out passes on play-action boots and sprintout remained at about the same rate overall as last year but came with some pretty telling splits: Nebraska rolled out on just 11.8% of passes in the first half of last season, but upped that rate to almost 16% in the final six games. Rollout and sprintout passes are common answers by offensive coordinators to poor pass protection — running the quarterback away from the offensive line at the snap — and to quarterbacks without game experience — rollouts simplify the read to half of the field and take away more complex decisions. All of Nebraska’s seven reps of true sprintout passes came with Lateef in the game. The staff didn’t feel the need to cut the read in half with Raiola but did with Lateef.
All of Nebraska’s movement in the first six games came from rollouts under center, which had a success rate of over 75% in that stretch. Those rollouts got much worse in efficiency in the second half of the year, falling to a success rate below 50%.
The movement rate went up to 17% of all passes in Lateef’s starts, and movement passes in his games had a 58.3% success rate — far and away his most successful concepts.
Pass Protection
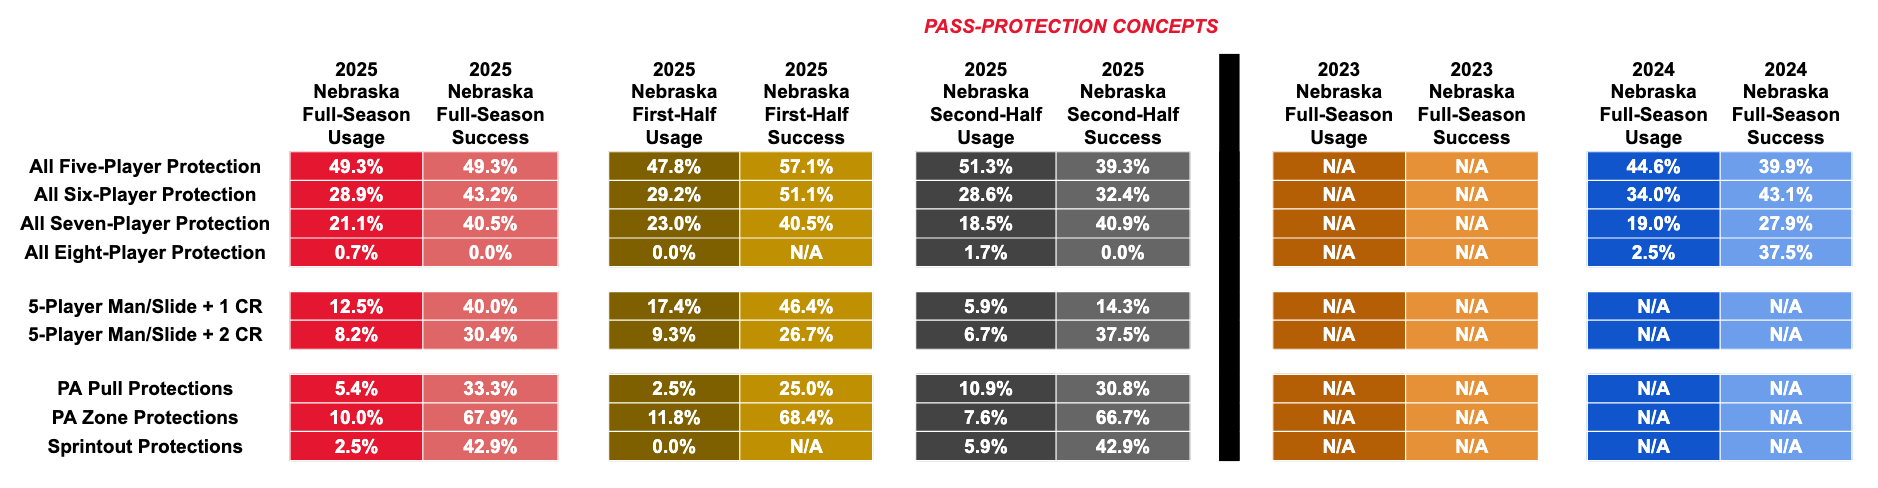
I charted protection a little differently this season, so it wasn’t really applicable to compare this year’s data to past seasons.
Some of these success rates might seem surprisingly high, given we all watched the protection be pretty disastrous this season, but keep in mind the success rate counts if the play was successful, not if the protection was bad. So a play where a QB made a great escape on a blown protection and completed a pass would count as a “success,” even though the protection was a problem for that rep. I still don’t love how I charted the protection this season, but this should at least just catalog what Nebraska was running; the isolated player pass-blocking metrics later in the post will be more telling at how the protection actually performed.
Seeing the rate of five-player protections rise in the second half of the season probably seems counterintuitive to Nebraska’s struggles in pass pro — i.e., keeping more people in to protect to help the line — but that rise in five-player protection concepts was more due to NU increasing its quick-passing rate; those concepts necessitate five players out on routes, which means five in protection. Nebraska’s answer to the pass pro busts was generally just to try to get the ball out faster, rather than keep more blockers in.
Which makes sense when you see how bad Nebraska was at any sort of deep-throw protection with extra blockers. Nebraska’s plays with seven players in protection and anything with chip help — protections you’d use to try to buy time to throw longer passes down the field — all had pretty disastrous efficiency, especially in the back half of the year. Downfield throws are harder to complete and are thus always going to be lower in efficiency, but NU’s rates fell off pretty substantially — its true dropback passes with a single chipper had just a 14% success rate in the final six games. That lack of success on deeper throws was not all on the line, but I think it’s illustrative overall of how little Nebraska was getting down the field through the air in the second half of the season. Which is especially glaring considering how strong a running game NU had to throw off of in the final six game; it should have been able to feast downfield with as much attention and resources as defenses were devoting to stopping the running game.
Passing Concepts
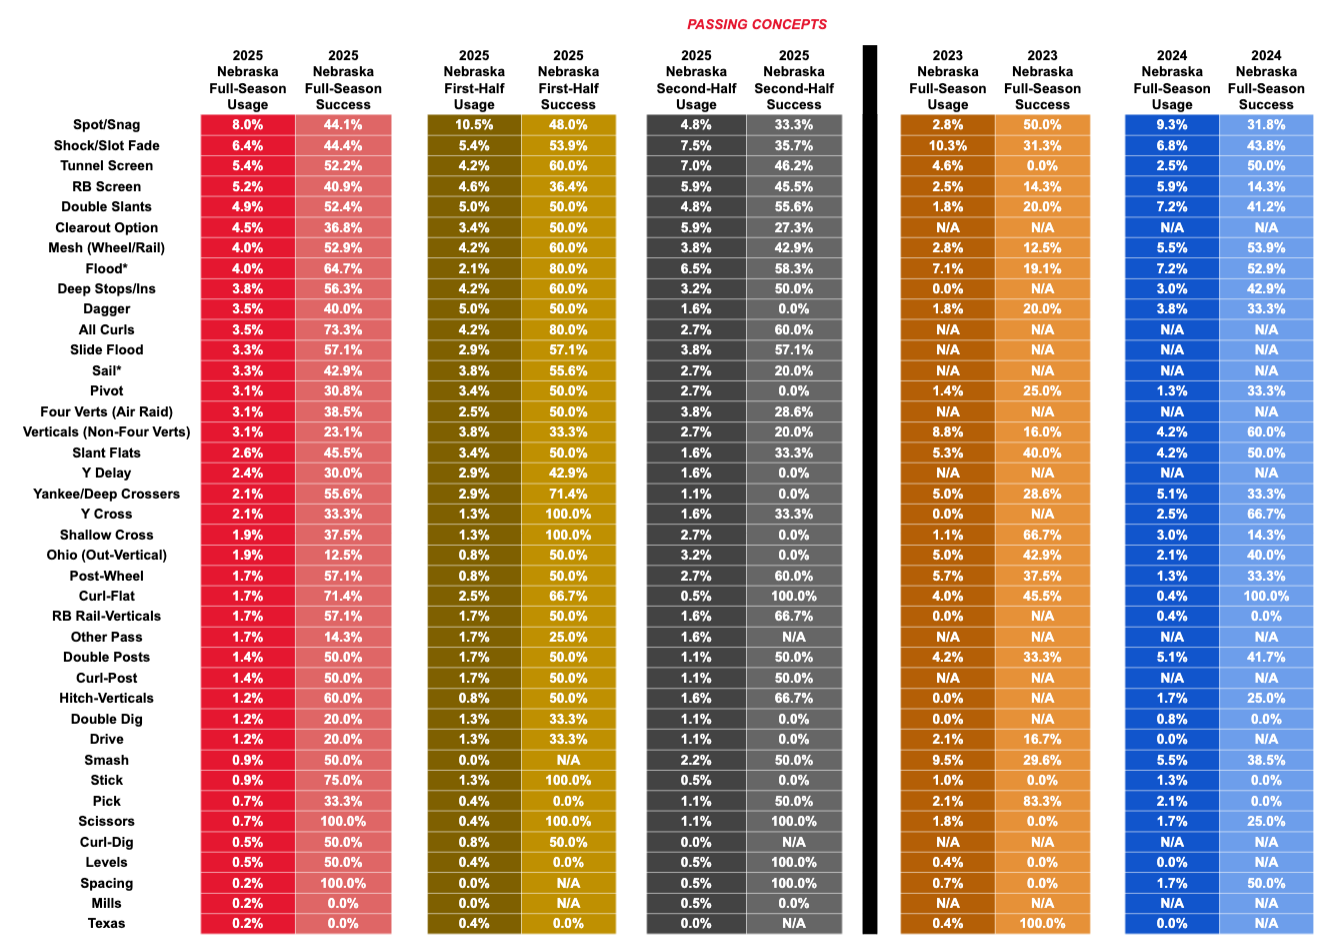
This is a lot of data and is difficult to parse, but there are some clear trends here.
The first is that Nebraska had a deeper bag of individual passing concepts to pull out of this season than in past years, which speaks to its quarterback’s improvement — Raiola was trusted to run more stuff and given a more diverse menu during games.
In 2023 with abysmal quarterback play, NU essentially ran slot fades, three-level floods, high-low smash, deep crossers, vertical shots, and post-wheel, slant-flat, and out-vertical combinations — and little else. These eight concepts constituted 57% of the passing game. The menu was a little more diverse last season, but the top eight concepts still were 51.9% of the passing game.
But this season, the top eight concepts represented just 42% of the offense, with NU’s most-used concept coming in at just 8% usage. Nebraska utilized 16 concepts on more than 3.0% of its true passing plays, compared to just 11 concepts getting more than 3% usage in 2023 and 12 getting more than 3% usage in 2024. Holgorsen, I think, pretty undeniably expanded the passing game menu despite his talk of streamlining the attack. The passing game improved, so that’s not a criticism.
Nebraska’s main passing concepts this year, in order of usage, were Spot, Shock (which also includes all slot fade plays), tunnel and running back screens, Double Slants, Clearout Option (with a vertical clearout downfield and underneath option route), Mesh Wheel, Dropback Flood (In past years, I charted Flood and Sail concepts in the same bucket but broke them out separately this year), Deep Stops/Ins, Dagger, All Curls, Slide Flood, Sail, Pivot, Air Raid Four Verts, and other vertical-style plays not in a specific bucket. Those were the concepts I would say we saw Nebraska run at some point in almost every game.
Nebraska did incorporate many of Holgorsen’s base Air Raid principles into the offense. Spot/Snag, Mesh, All Curls, and Four Verts are all Air Raid staples or variations and saw regular usage. A robust screen game — specifically on tunnel screens out to receivers — is also part of how the Air Raid functions. Satterfield’s preferred passing concepts (Post/Wheel, Yankee, Shock, and dropback Flood) all saw drop-offs in usage, sometimes pretty heavily. The narrative that Holgorsen wasn’t allowed to call his stuff and had a playbook foisted on him is, I think, pretty much not backed up at all in the play-usage numbers.
PLAYER PERFORMANCE
QB Performance
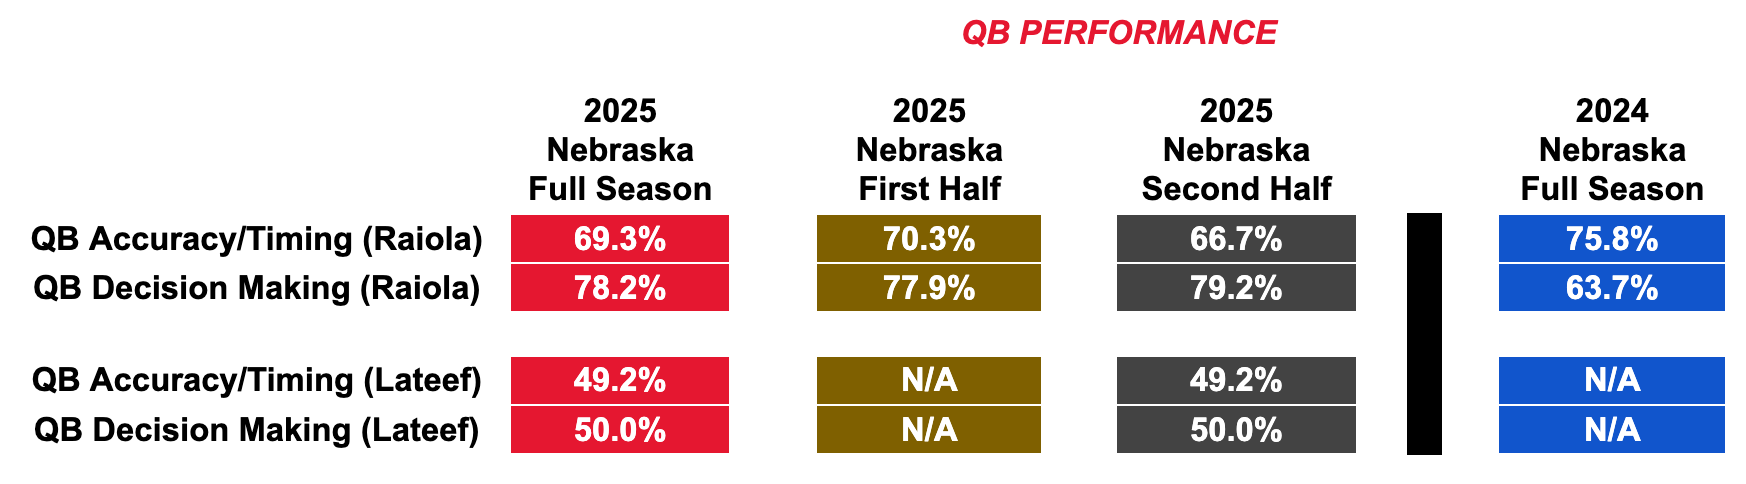
This is my measure of quarterback play, through decision making, timing, and accuracy.
The disclaimer on the decision making is that I’m not in the building and don’t know what people are being taught or specific progressions. But you can also tell some elements of quarterback play without knowing the specifics, such as opening to the zone-beating side of a concept against zone or not going through the generally taught reads of a concept. Accuracy is a bit picky for me — to be considered accurate, the pass has to be in the ideal spot away from the defense in contested situations or to enable run-after-catch with a more open receiver. A pass can be completed and not count as an accurate pass. Timing is the ball hitting receivers as they make their breaks or shortly after and not having to wait for passes when open and early in the read.
I graded Raiola’s accuracy and timing a little worse this season but his decision making much better — that’s been, I think, well established in other data I charted this year, too. I thought he operated with much sharper decisions, and, in quick game in particular, got the ball to the correct receiver fast on most plays. He obviously had some ugly reps of holding the ball too long at various points in the season, but those were largely a handful of dropbacks in each game and came on deeper passing concepts where he was attempting to make a big play. I thought — and the data says — he displayed much-improved ability to get rid of the ball on most of his plays, with a few lapses per game.
Lateef was much worse in both categories grading off the same metrics and standards. Lateef was generally accurate but was frequently late when he did find the right receiver, which was the main culprit in the accuracy/timing stat being low. And he just missed open receivers early in the read frequently, at a rate much lower than Raiola did as a true freshman. The timing and decision making are things you would think could improve with more game reps, but my general takeaway from Lateef’s three starts was that he was not ready to be on the field. Which isn’t really a knock: Most programs are prepared enough to not have to thrust true freshmen QBs into key games. Not being ready when thrust into the lineup as a true freshman isn’t necessarily an indictment of what any quarterback could be in the future, but I also don’t think there was anything in those three starts from Lateef that showed good play. He should be viewed as a lottery ticket that could pay off, not a surefire option. I’d be in the portal for a definite starter.
Run and Pass Blocking
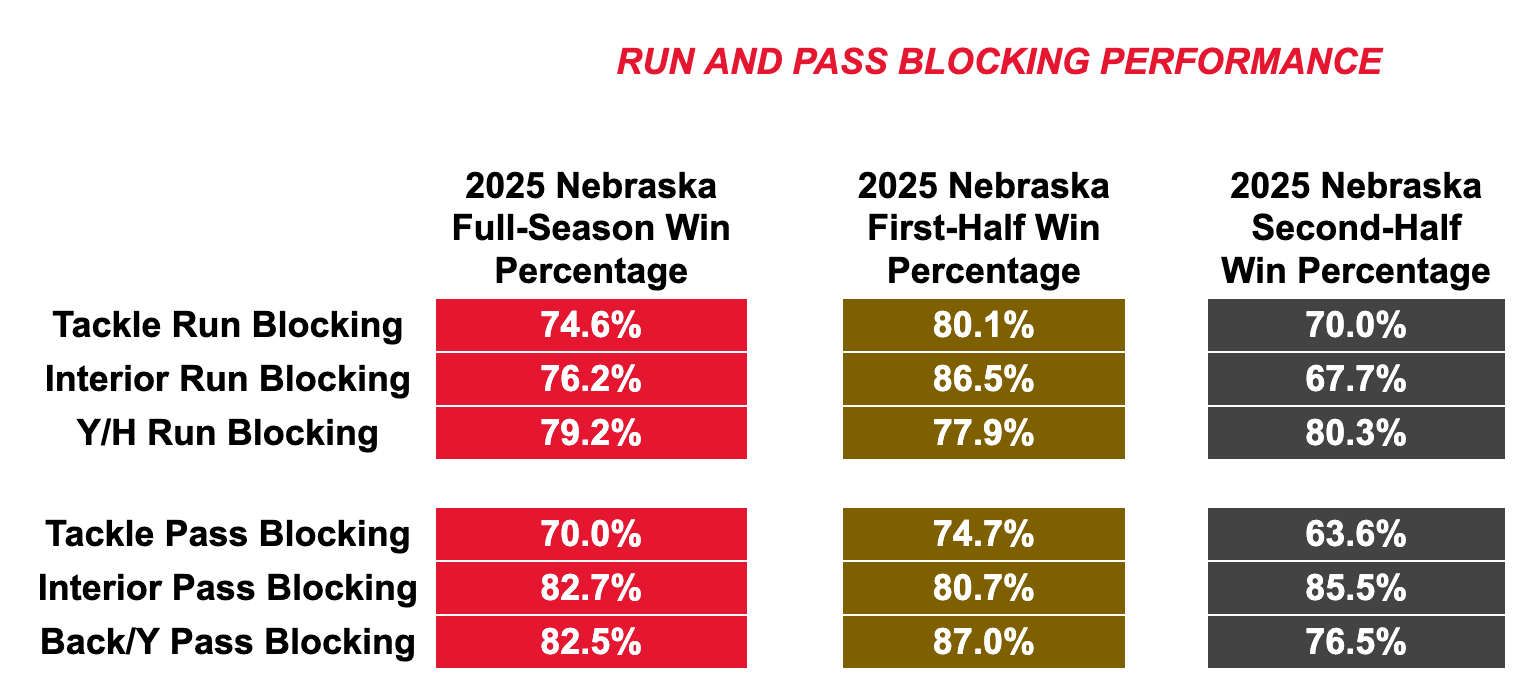
This and the next section on receiver performance were something new I tried to chart this season, so there’s no data to compare to past years. I didn’t necessarily love how this or the receivers charting turned out: It felt more subjective than my other stats/charting, which made it seem less like hard analysis and more open to my own interpretation on that day I was watching the film. Still, I’ll share it here, since I did track it all year.
On run blocking, the data would seem to argue with the actual production: I had the run blocking graded much higher in the first six games — when Nebraska wasn’t running the ball for much yardage — and the blocking graded lower in the final six — when Nebraska was running the ball for a lot of yardage. Part of that is that was that the staff just got a better plan for the run game in the second half by focusing on Duo, I think, and because Johnson was just special, frequently picking up yardage or getting chunk gains when the blocking was poor or exploded.
Part of the run blocking grade being higher early was the level of competition. The tackle run blocking grade in the first half of the season, in particular, was almost totally inflated by the games against Akron, Houston Christian, and Maryland where the tackles had 91.3%, 81.3%, and 84.6% win rates, respectively. Those were just not very talented teams. The tackles were at 64.7% against Cincinnati and 76.0% against Michigan. Off the eye test, I personally felt the tackle run blocking was improved in the back half of the season with Pritchett and Corcoran manning the spots, even if the numbers would suggest the opposite.
One other note in the run game is how good the tight ends were at executing run blocks all season. Nebraska’s use of Jumbo/extra linemen sets probably helped that number a bit — I charted the extra offensive lineman as a tight end when deployed on the field — but Lindenmeyer and Haarberg were both strong blockers all year. Haarberg, in particular, was quite a surprise in that element; I think most people pictured the former QB as more of a receiving threat before the season, but he actually ended up being best deployed as a brawler on movement or slice blocks or executing combos with linemen.
On pass blocking, you can see the tackle performance fall off pretty decidedly in the second half of the year — no surprise there to anyone who watched the games. It is worth noting that the interior trio of Henry Lutovsky, Justin Evans, and Rocco Spindler were a good group in pass protection consistently all year. The pressures weren’t coming from them.
WR Open Rate
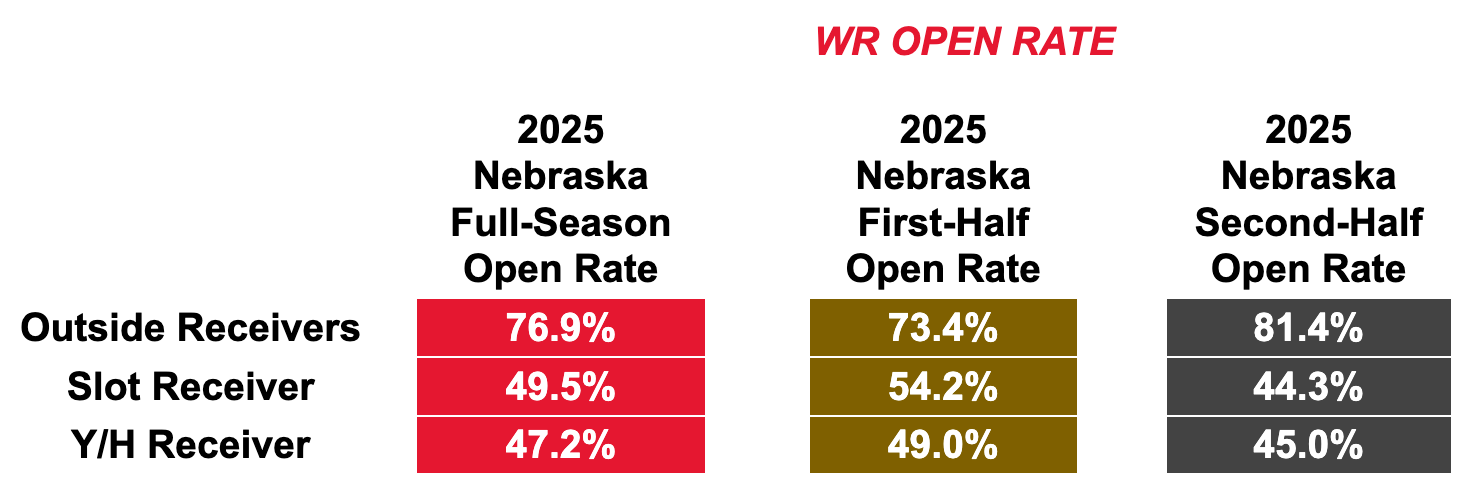
This is less a measure of receivers’ “win rate” against defensive backs and more a measure tracking the positions that got open on the concept, which is affected by the coverage the defense chooses to run: A certain route combo against a certain coverage is more likely to generate an open receiver in a certain spot, and not totally indicative of overall quality of the player running a route. It also meant it was harder for players in the middle of the field — slots and tight ends — to get open, because there are more bodies in that area of the field, especially in zone coverage. I’m not sure how revealing this ended up being for this year — it’s just detached percentages with no context — but this stat will probably tell us more in future years when we can compare. Still, here it is.
Thanks, as always, for reading and a happy holiday break to everyone.
This post was free, but the tendency post on the defense will be behind the paywall. If you enjoyed reading this and are interested in reading more film analysis and data-backed writing on Husker football, hit the subscribe button below and sign up. It’s $5 a month or $50 a year, and I’ve got posts planned breaking down the bowl game, NU’s new coaches’ philosiphies and tape at their last stop, and transfer portal additions. Posts are less frequent during the offseason because researching informed content takes time, but are often longer and more comprehensive.
Apologies for the random usage of colors; I was just trying to find things that were visually distinct and readable.
Which at the time seemed unnaturally high and were not reflected in the tape I was watching last year; that did not seem remotely like a top 50 offense in anything it was doing. I’m more or less writing those off as inflated.
A mini-diatribe here, but this is why the claims that “Dana Holgorsen wasn’t able to run his offense” from the message boards or wherever ring false to me. Offensive football in 2025 is about getting bigger and more burly to punish smaller defenses built to stop the spread — I don’t think Holgorsen was running so much under center with extra linemen on the field because he was mandated to by Matt Rhule; I think that doing so is just good offensive scheme in this era of football. Getting spread out to pass in the Air Raid is what the defenses are now built to stop.
I did not keep specific RPO data in 2023, so it isn’t included here.
Not to make a long post longer but can we get some superlatives to make it pop? Everyone likes superlatives! Which receiver gets the 'got open way more than he got targeted' or which olineman gets the 'actually way better than pff would indicate'?